In this post, you will find a detailed guide to the Power BI learning path based on the needs of the person who has never worked with Power BI before to learn in 2025 what to study, what to read, and what skills to devlopment
What is power BI?
Microsoft Power BI Power BI is a business analytics application technology mainly used to connect to databases, drag and drop raw data to develop meaningful insights, render interactive dashboards and reports, and allow one to share dashboards and reports with others within the organization or across a web.
Core Components:
1. The primary application to create reports is called Power BI Desktop.
2. The online share and collaboration platform is called Power BI service.
3. Power BI Mobile- Show reports and dashboards in mobile devices.
4. Power BI Gateway With Power BI Gateway, you can connect on premises data in a secure way.
5. Power BI Report Server -Hosting of reports in the presence.
Why you should Learn Power BI in 2025?
High Need: With the adoption of data informed cultures by the business, there is a high need of Power BI professionals.
Microsoft Ecosystem Integration: Excel, Azur, and other Microsoft products integration without any complications.
No Coding Needed (at first): The beginners are able to start building powerful dashboards with easy drag-and-drop approach.
Increasing Community and Support: High number of users, user-friendly upgrades and high quality of online support.
Inexpensive and Available: Power BI Desktop is free of charge to personal use.
Power BI Learning Path -Simple step by step for beginners
Step 1: Know the Basics of Business Intelligence
It is necessary to learn about BI definition before getting to the tool.
The Business Intelligence What.
BI is the gathering, analyzing and presentation of business data to assist in decision-making.
Some of the important concepts to be learned:
Data Sources
Extract, Transform, Load (ETL)
Data Warehousing
Key performance indicators (KPIs)
Tachyon Dashboards and Tachyon Reports
Step 2: Let us start with Power BI Desktop
Download Power BI Desktop program on the official [Microsoft Power BI site](https://powerbi.microsoft.com/).
Get to know the Interface:
Ribbon, panes, and views (Report, Data, Model)
Browsing field and images
Practice Tasks:
Link to the Excel, or CSV file
Load clean data
The drag-and-drop can be used to create simple charts
Resources:
Power BI Power BI Modules
Free Power BI Guided Learning
Beginner course at Uncodemy in Noida
Step 3: Learn data connections and data loading
The knowledge of importing data to Power BI is vital.
Skills to be Learned:
Linking to other resources: Excel, SQL Server, Web, SharePoint, Azure
data Load options: direct query vs. import
Power Query Editor:
Data transformations (elimination of nulls, Type conversions)
Sifting and refraction of data
Tables merging (Merge and Append)
Resources:
official documentation on Microsoft Power Query
Uncodemy courses in Noida
Step: 4 Power BI Data Modeling
As soon as data is loaded, the construction of relationships and establishment of the satisfactory data model is a priority.
Key Concepts:
Tables, Relations (One-to-Many, Many-to-One)
Star Schema Vs Snow flake schema
Measures and Calculated columns
Training in DAX (Data Analysis Expressions):
Simple operations: SUM, COUNT, AVERAGE
Logical functions IF, SWITCH
Time Intelligence: YTD, MTD,
Step 5: Designing of the visualizations and dashboards
Here your data is brought to life.
Common Visuals:
Bar chart, Line, Pie charts
Tables and Matrix
Cards and Maps
Filter and slicers
Best Practices:
Stay off the dashboards and clutter-free and be ready to use
Put suitable colors and names
Don t clutter and have unnecessary illustrations
Step: 6 Power BI Service and Sharing Reports
Once you have constructed your reports, get to know how to publish and collaborate.
The Features of Power BI Service:
Power BI Desktop Available reports
Production and distribution of dashboards
Registering alert and subscriptions
Role based access control
Setting of the schedules of data refresh
Step 7: Ability to Advanced Data analysis using DAX
After you start getting familiar with basic DAX, proceed to intermediate and advanced functions.
Areas of Discussions:
Row vs. Filter Context: On the one hand, creating a row takes longer than creating a filter; in the central context, the row is constructed in the same amount of time as the filter; on the other hand, it is quicker to create a row than a filter.
CALCULATE, ALL, RELATED Advanced Measures
Ranking, Percentile and Running Totals
Resources:
The books such as the definitive guide to DAX by RussoFrat vs Ferrari
The library DAX Patterns
Step 8: Learning Power BI AI and Advanced
The 2025 version of Power BI has multiple AI options incorporated.
Smart Features:
Q/ A (Natural Language Queries)
Intelligent Stories (Self converting insights)
Fore casting and Anomaly Detection
R and python Integration
Individual Designs and Scripting:
Or design third party images
Combine the Python or R scripts to do a more analytical work
Step 9: Working on real project and cases
Perform your skills in real-life data sets.
Ideas:
E-commerce eCommerce sales dashboard
Analysis of the trends of COVID-19
Dashboard of HR analytics
Financial statement of small company
Step 10: Certification and become a member
Certification is an option to consider when you are serious about a career in data analytics.
Microsoft Certifications:
PL-300: Power BI-Data Analyst Associate
Topics of the Exams:
Preparing data
Modeling data
Visualizing data
Installation and sustenance of assets
Community Engagement:
Become part of Power BI Community and forums
Get into online meetings and webinars
Follow such influencers as Alberto Ferrari, Ruth Pozuelo
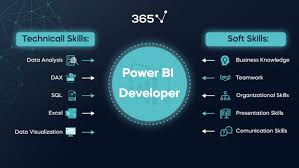
What tools to be acquainted with in 2025?
Excel- To clean the original data or to interface to spreadsheets
SQL-To write queries in case of connecting to databases
Azure Data Services- When you need data hosting on enterprise level
Power Automate and power apps- Automation and app creation with Power BI
Recommended 8 weeks Power BI study schedule (Beginner)
Week | Area of focus
---- | ---------------------------------- (Flew 2009, 120).
1 BI Fundamentals + Power BI desktop
2 | Connecting and Transforming data | Facebook hosting services
3 Data Modeling, introduction to DAX
4 |storytelling, and visualizations
5 Power BI Service & Sharing
6 | Time and advanced DAX
7 AI Features & Integration |
8 | Capstone Project + Certification Prep | Within Sacred Earth, we feel that each of us is sovereign only in our physical body as we embark on a journey of experiential learning and healing. We identify those who feel conscious awareness in their physical body, to those who expire, or those who set out on experiential learning and followed suit. We also recognize those who have been in a financial slump, in the same way that we recognized those who are enlightened and followed suit.
Carrier Prospects post learning Power BI
After you have got a handle with Power BI, there are many different directions your career may take:
Data Analyst
Business intelligence Analyst
BI Developer of Power
BI Consultant
Data Visualization analyst
The last Winning Advice
Practice makes Perfect: Practice makes Perfect: open Power BI and experiment on a regular basis.
Real Problem Solving: Just select problems of interest area.
Stay Updated: The Power BI is changed and developed with new functions; keep learning.
Share and ask to be collaborative: use your dashboards and seek comments.
Develop a Portfolio: Write your dashboards roundup in a blog, or on GitHub.
Conclusion
Power BI learning path in 2025 is more open, organized and exciting than ever before. As a student, professional, or an entrepreneur in the business world, power BI is a tool that can give you the power to make data-driven decisions to utilize your potential to no end. Duly follow this learning path and you will be even close to mastering one of the strongest BI tools in the world.
Do you want to make a decision out of data? Begin Power BI adventure now!