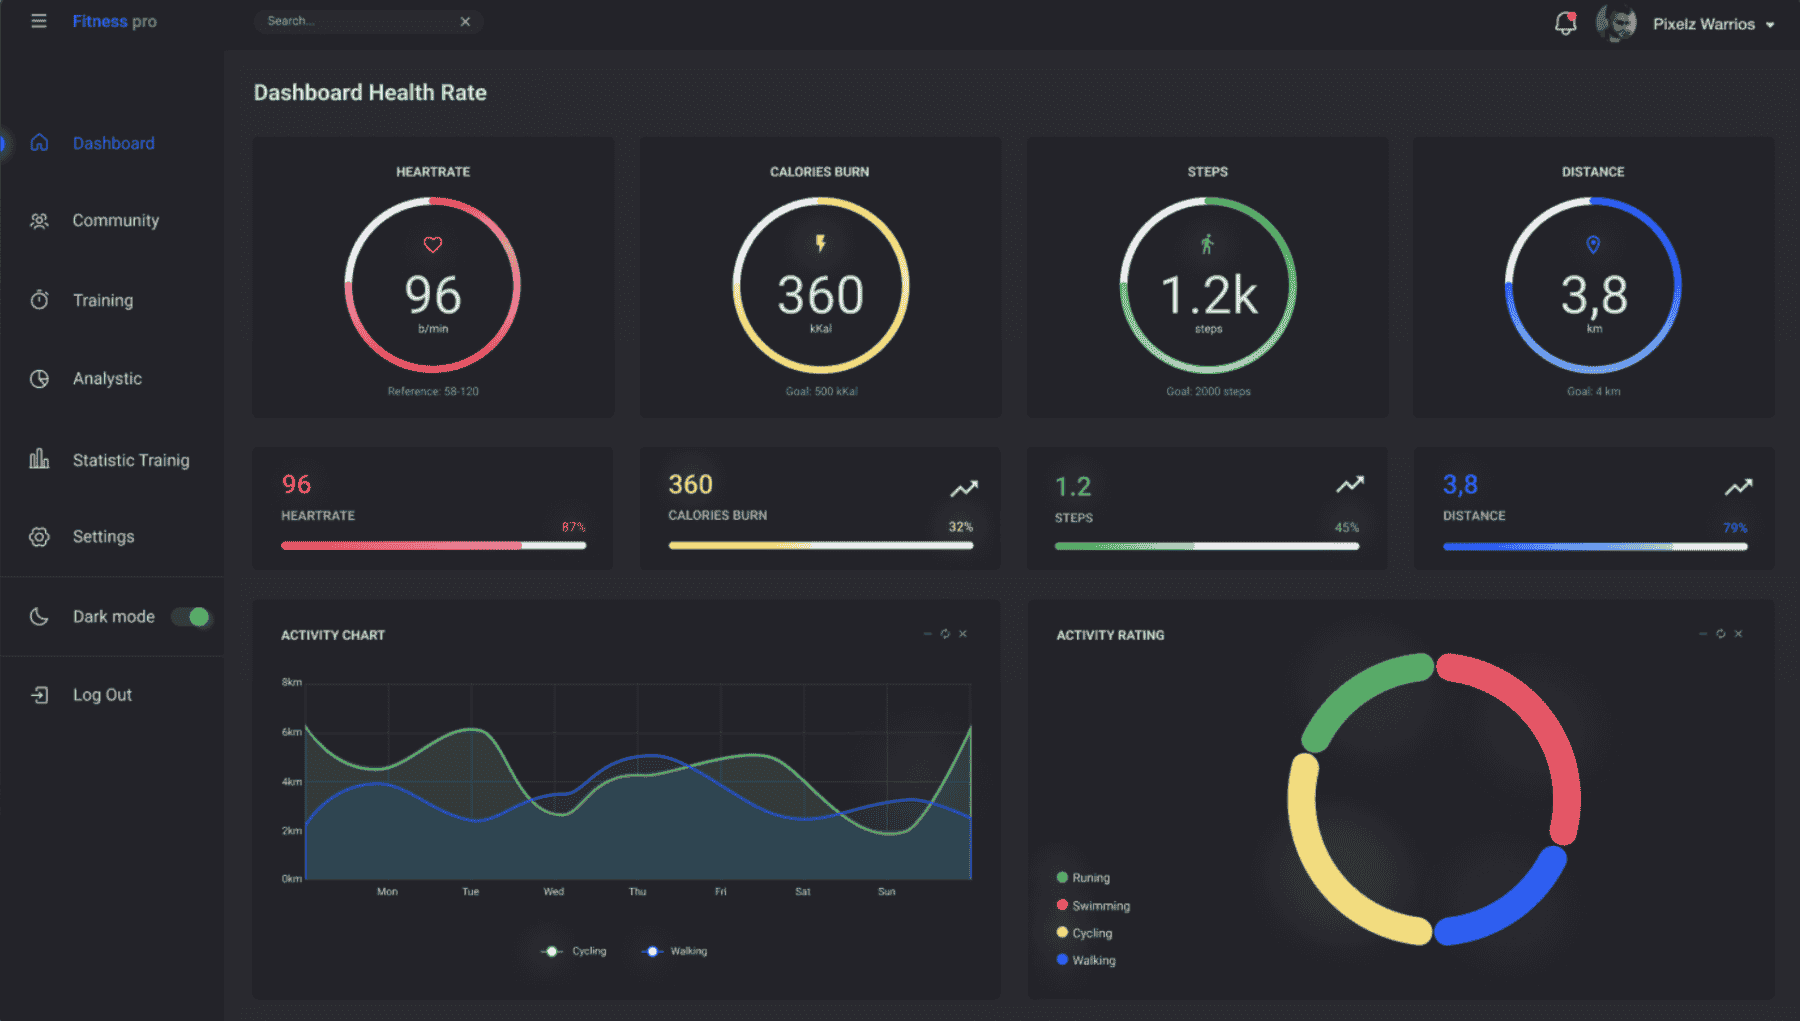
A fitness tracker dashboard consolidates multiple data points into a single, visually engaging interface that helps users interpret their health progress. Instead of staring at numbers, users can look at clear charts, graphs, and progress bars that show patterns and trends. In this article, we will explore how to build a fitness tracker dashboard, why data charts are essential, what tools and technologies you can use, and how to make the dashboard more user friendly and engaging.
Why Build a Fitness Tracker Dashboard
When people start their fitness journeys, they are often motivated but lack visibility into how their body is responding. A dashboard can solve this issue by offering clear feedback loops.
- Improved Visualization
Raw numbers like 8500 steps or 2100 calories burned may not seem meaningful on their own. But when you see them on a bar chart compared to previous days, the context makes it more useful.
- Motivation through Progress Tracking
Visual milestones encourage people to keep going. Seeing progress bars fill up or trend lines move upwards can motivate users to continue with workouts and healthy habits.
- Behavioral Insights
A dashboard helps reveal patterns. For example, you might notice that your step count is consistently lower on weekends or your calorie burn dips during work from home days. These insights can lead to adjustments in lifestyle.
- Centralized Health Management
Most fitness data is scattered across multiple devices or apps. A dashboard can centralize everything into one clean and easy to access platform.
Features of an Ideal Fitness Tracker Dashboard
To make the dashboard practical and engaging, here are the core features you should consider:
- Activity Tracking
Show steps, distance walked, and calories burned in visually engaging charts. Daily, weekly, and monthly views give better perspective.
- Workout Logging
Allow users to log their exercise sessions such as running, cycling, or weight training. Charts can show the frequency and intensity of workouts over time.
- Heart Rate Monitoring
A line graph for heart rate can show daily averages or fluctuations during workouts.
- Sleep Analysis
Sleep quality and duration can be tracked and displayed using pie charts or timelines.
- Nutrition Tracking
Display calories consumed versus calories burned. You can use bar charts for daily intake and macros breakdown.
- Goal Tracking
Progress bars are effective for showing progress toward personal goals, such as completing 10,000 steps or drinking 3 liters of water daily.
- User Friendly Interface
The dashboard should feel intuitive and clutter free. Minimalism and ease of navigation play a big role in user satisfaction.
Tools and Technologies You Can Use
Building a fitness tracker dashboard is not as intimidating as it sounds. With modern tools, you can create one efficiently.
- Frontend Development
For the user interface, technologies such as HTML, CSS, and JavaScript are essential. Frameworks like React or Vue can speed up development.
- Data Visualization Libraries
Charts are at the heart of the dashboard. You can use libraries such as Chart.js, D3.js, or Recharts to display engaging graphs and charts.
- Backend Development
Node.js is a strong choice for handling the backend because it is fast and well suited for real time applications. Express.js can serve as the framework to build APIs.
- Database
To store fitness data, you can use MongoDB for flexibility or MySQL if you prefer structured tables.
- APIs and Integrations
Wearable devices like Fitbit, Garmin, or Apple Watch often provide APIs that let you pull user data into your own dashboard.
- Authentication
If the dashboard is multi user, secure authentication will be necessary. Libraries like Passport.js or JSON Web Tokens can help here.
Step by Step Approach to Building the Dashboard
Here is a practical roadmap to build a fitness tracker dashboard.
Step 1: Define Scope and Metrics
Decide what health metrics you want to track. A minimal version might focus only on steps, calories, and heart rate.
Step 2: Design the Layout
Sketch the dashboard. Decide how the charts, progress bars, and navigation should be arranged. A clean and minimal layout is always better.
Step 3: Set Up Backend
Use Node.js with Express.js to create routes and handle data flow. Connect the backend to a database such as MongoDB where fitness logs will be stored.
Step 4: Pull Data
If integrating with wearables, fetch data using their APIs. Alternatively, allow manual logging from the user interface.
Step 5: Build Frontend Components
Use React or Vue to build the interface. For example, one component for daily steps, one for calories burned, and one for sleep analysis.
Step 6: Integrate Data Charts
Use Chart.js or D3.js to create visualizations. For instance, a line chart for heart rate, a bar chart for steps across the week, and a pie chart for macros distribution.
Step 7: Add Goals and Progress Indicators
Include visual trackers that show progress toward goals such as completing a step target. Progress bars are simple yet effective.
Step 8: Optimize for Mobile
Fitness dashboards are often checked on mobile devices. Ensure that the design is responsive.
Step 9: Test with Real Users
Run usability testing to see if users understand the charts and can navigate easily. Refine based on feedback.
Step 10: Deploy and Maintain
Host the dashboard using cloud platforms like AWS or Heroku. Regularly maintain and update features based on evolving needs.
Example of a Data Chart Implementation
To give you a practical sense, here is a simple code example using Chart.js to display steps for the week.
Copy Code
<canvas id="stepsChart"></canvas>

<script src="https://cdn.jsdelivr.net/npm/chart.js"></script>

<script>

const ctx = document.getElementById('stepsChart').getContext('2d');

const stepsChart = new Chart(ctx, {

    type: 'bar',

    data: {

        labels: ['Mon', 'Tue', 'Wed', 'Thu', 'Fri', 'Sat', 'Sun'],

        datasets: [{

            label: 'Steps',

            data: [8500, 9200, 7500, 10000, 11000, 12000, 8000],

            backgroundColor: 'rgba(54, 162, 235, 0.6)'

        }]

    },

    options: {

        scales: {

            y: { beginAtZero: true }

        }

    }

});

</script>
This simple snippet creates a bar chart showing steps taken each day of the week. By combining such charts, you can gradually build a comprehensive dashboard.
Best Practices for a Fitness Tracker Dashboard
- Focus on Simplicity
Avoid overloading the dashboard with too much information. Provide the most relevant metrics clearly.
- Use Color Intelligently
Colors can signify progress, goals, or warnings. For example, green for meeting step goals, yellow for average performance, and red for falling short.
- Provide Multiple Views
Daily, weekly, and monthly views give users a better understanding of long term patterns.
- Ensure Data Accuracy
If pulling from wearables, ensure that syncing is reliable. Users lose trust when the data feels inconsistent.
- Make It Personalizable
Allow users to customize their dashboard. Some may care more about sleep while others may focus on calories or workouts.
Future Enhancements with Advanced Tech
Fitness dashboards can also evolve with technology. Here are some possibilities:
- AI Insights
Artificial intelligence can analyze patterns and suggest personalized tips. For example, it can recommend earlier bedtimes based on sleep data.
- Predictive Analytics
The dashboard can forecast weight changes or predict risk of fatigue based on data trends.
- Integration with Smart Devices
You can connect the dashboard with smart water bottles, scales, or even gym equipment for richer data.
- Community Features
Adding leaderboards or sharing options can make fitness journeys more social and engaging.
Final Thoughts
Building a fitness tracker dashboard with data charts is an exciting project that merges health awareness with Full Stack Development course from Uncodemy technology in Delhi. It empowers users to see their journey, understand trends, and stay motivated toward better health. The process involves defining metrics, pulling data, building an engaging frontend, and adding insightful visualizations. With tools like Chart.js, Node.js, and APIs from wearables, it is more achievable than ever to create a professional looking and highly functional dashboard.
In the end, the goal is not just to build a dashboard but to inspire healthier lifestyles. When people see their hard work represented in beautiful charts and progress indicators, it reinforces their commitment to fitness. For developers, this project is not just a coding exercise but an opportunity to make a meaningful impact on how people manage their health.