Chi-Square Test: Formula, Use, and Applications Explained
-
Mr. Kunal Arora / 1
day ago
- 0
- 8 min read
What is the Chi-Square Test?
It is the statistical process that will help in determining the difference
between observed and expected data. It is mainly used to decide whether this data is correlated
with our categorical variables. A chi-square test is also called a nonparametric test that
requires a hypothesis regarding the distribution of our categorical variable. Categorical
variables mean categories like plants, animals, or even countries. They should not have a normal
distribution because they only have particular variables.
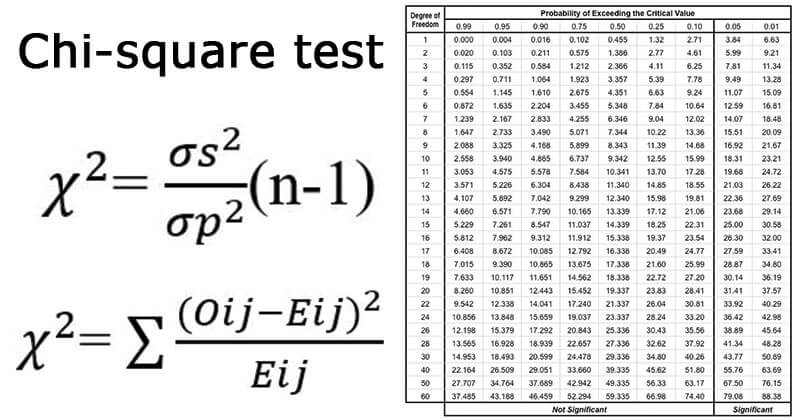
Chi-Square Test Formula
Here,
C = Degrees of freedom
O = Observed Value
E = Expected Value
The degree of freedom represents the number of variables that can vary. They are
calculated to ensure that all these chi-square tests are quite statistically valid. Observed
data is compared with expected data to determine if a particular hypothesis is true or not.
- Observed values simply mean the data you collected.
- Expected values are some of the anticipated frequencies based on a null
hypothesis.
What are the Fundamentals of Hypothesis Testing?
Hypothesis testing is a technique used in interpreting and drawing inferences
about sample data. There are two types of hypotheses:
- Null Hypothesis (H0) - This hypothesis means that the event will not
occur. There is no bearing on study outcomes unless rejected. H0 is the symbol used for it,
and you can pronounce it as H naught.
- Alternate Hypothesis(H1 or Ha) - This is the logical opposite of the null
hypothesis. Acceptance of this alternate hypothesis means rejection of the null hypothesis.
H1 is one of the symbols used for it.
What are the Types of Chi-Square Tests?
The two main types of Chi-square tests are :
- Independence
- Goodness-of-Fit
-
Independence -This chi-square test of independence is one of the
derivable statistics used that examines whether two sets are related or not. You can use
this test when you have counts of values for two nominal or categorical variables, and
also consider it as a non - non-parametric test. Large sample size and independence of
criteria are some of the required criteria for conducting this test.
Example - Suppose in a movie theatre, we have a list of some movie
genres. Now, let us consider this as the first variable. The second variable is whether
or not people who came to watch this movie genre bought snacks at the theatre. So here
the null hypothesis is that the genre of the film and whether those people bought snacks
are unrelated. So if true, then it means that the movie genre doesn't impact snack
sales.
-
Goodness-of-Fit - This will determine whether a variable is going to come
from a distribution. A set of data values is required, and an idea of the distribution
of this data. Using this test is good when you have value counts of categorical
variables. This will help determine whether data values have a good fit for your idea or
if it is a representative sample of the entire population set.
Example - We have bags of all's with 5 different colours in them. The
condition is that bags should have an equal number of balls of each colour. The idea to
test is that the proportion of each colour of ball in each bag must be exact.
What are the Examples of the Chi-Square Test?
How to Perform a Chi-Square Test?
For this, let's consider like if a gender has anything to do with the preferences
of people for the political party.
- Step 1: Define the Hypothesis first
- H0 - This tells that there is no link between gender and
political party preferences.
- H1 - This indicates a relationship between gender and political
party preferences.
- Step 2: Calculation of Expected Values
- Calculate the expected frequency with this
So the expected value for making a republican is :
Before concluding, determining critical statistics is essential for degrees of
freedom. In this case, we can see that the degree of freedom is equal to the table's number of
columns minus one multiplied by the table's number of rows minus one, or (r-1) (c-1). We have
(3-1)(2-1) = 2.
Compare these critical ones in the chi-square table. As we can see, with an alpha
level of 0.05 and two degrees of freedom, the critical statistic is 5.991, less than our
obtained statistic of 9.83. So we will reject the null hypothesis here because we can see that
the critical statistic is higher than the obtained statistic.
Now we have sufficient evidence that we can say that there is a relationship
between gender and political party preference.

What are Categorical Variables?
These categorical variables are a subset of all variables that will be divided
into discrete categories. All these variables are qualitative because they will depict the
quality pr characteristics of a variable. These variables are divided into two categories.
- Nominal Variable - These variables have no natural ordering. Gender,
blood group are some of the examples.
- Ordinal Variable - A variable that allows categories to be sorted is an
ordinal variable. Customer satisfaction, like good, very good, excellent, average, bad, and
so on, are some examples.
Chi-Square Practice Problems
- Voting Patterns :
Problem - A researcher is interested in knowing whether voting preferences (
party A, party B, or party C ) and gender (male or female ) are related. So chi-square test is
applied to the following set of data.
- Male: Party A - 30, Party B - 20, Party C - 50
- Female: Party A - 40, Party B - 30, Party C - 30
Solutions - To determine if the gender parameter influences voting preferences, a
chi-square test for independence is used.
-Consumer Preferences :
Problem - A company will survey customers to determine age group (like under
20,20-40, over 40) and some of the preferred product categories ( food, apparel, or electronics
). The information gathered is mentioned below :
- Under 20: Electronic - 50, Clothing - 30, Food - 20
- 20-40: Electronics - 60, Clothing - 70, Food - 50
- Over 40: Electronic - 30, Clothing - 40, Food - 80
Solutions :
A chi-square test is used that will help in investigate a connection between
product preferences and age group.
When to Use a Chi-Square Test?
A chi-square test will help in determining whether the observed results
correspond to the expected results. When you analyse the data, that should be from the random
sample, while the variable used in the question should be categorical. In this scenario,
choosing the chi-square test is right and accurate.
Most commonly, this chi-square test is used for analysing the data. Such a kind
of analysis will help researchers in studying the survey response data. This research can easily
range from customer to market research to other political science and economics disciplines.
What is the P-value in a Chi-Square Test?
This is a statistical value that will help in assessing the importance of your
test results. Here, P simply means probability, so for calculating this p-value, the chi-square
is of utmost importance. Different p-values simply mean different interpretations of the
p-value.
- P <= 0.05 (Hypothesis interpretations/results are rejected)
- P >= 0.05 (Hypothesis interpretations/results are accepted)
Probability is the estimation of something that will likely happen. In simple
words, it is the possibility of the outcome of a sample. This probability may represent a
complicated or even bulky set of data. Statistics often involve collecting, organising,
analysing, interpreting, and presenting the data.
Conclusion
Be ready to learn everything that you want at your fingertips. Just enroll in the
Full
Stack Developer Course in Noida. Be assured that the right assistance is
available at your doorstep. For any queries, feel free to contact us anytime. We will give our
best. Solve your problem, as every step matters, and your dream career is also important.


