Confusion Matrix in Machine Learning: Concept, Formula, and Example
In the ever-evolving field of data science, understanding how well a machine learning model performs is crucial. After all, building a model is only part of the equation—the real value lies in its accuracy, reliability, and effectiveness when applied to real-world data. One tool that helps us gauge all of this in a very visual and informative way is the confusion matrix.
If you're pursuing a Data Science Course in Noida, chances are you’ve encountered the confusion matrix already. Whether you’re studying supervised learning or trying your hand at model evaluation, mastering this simple yet powerful tool is key to advancing your knowledge and building dependable AI models.
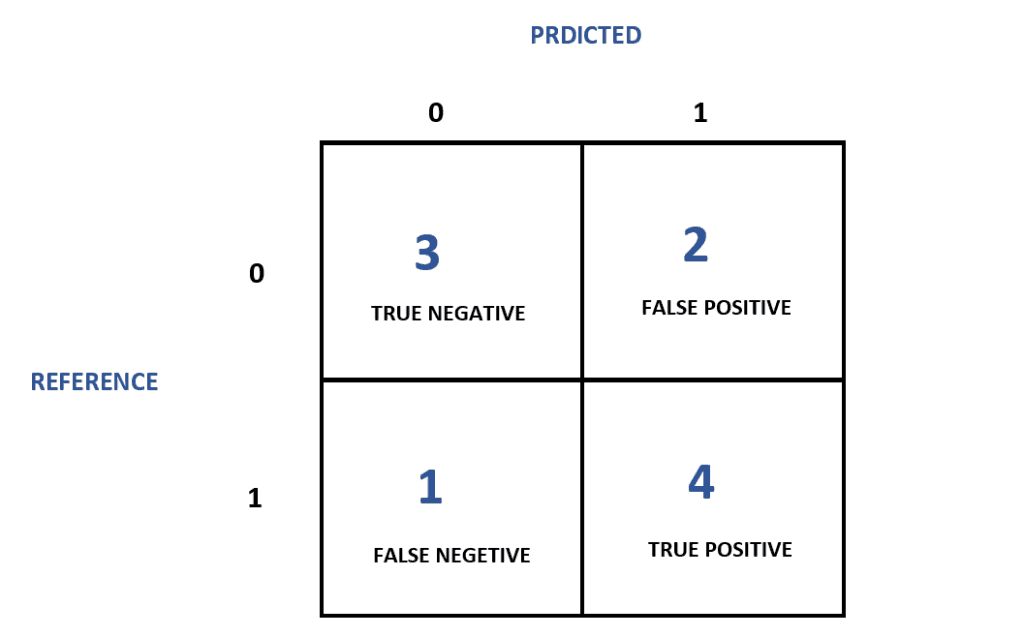
Think of the confusion matrix as a scoreboard for your classification model. It lays out where your model got things right and where it went wrong—but in a detailed and structured way. Typically used in classification problems, the confusion matrix breaks down predictions into four categories:
Predicted Positive
Predicted Negative
Actual Positive
True Positive (TP)
False Negative (FN)
Actual Negative
False Positive (FP)
True Negative (TN)
Let’s break these terms down with a simple analogy.
Imagine you're building a spam email detector. When it correctly identifies a spam message, that's a True Positive (TP). If it flags a regular email as spam, that's a False Positive (FP). If it misses a spam email and lets it pass through, it’s a False Negative (FN). And finally, when it correctly identifies a regular email as not spam, that’s a True Negative (TN).
This kind of breakdown helps data scientists know not just how often the model is right, but what kind of mistakes it makes. And that insight is gold.
Why Is the Confusion Matrix Important?
Most beginners are taught to measure a model’s accuracy—the percentage of correct predictions. But accuracy can be misleading, especially with imbalanced datasets. For instance, if 95% of emails are non-spam and your model simply classifies everything as “non-spam,” you’ll get 95% accuracy. But it won’t actually detect spam!
That’s why the confusion matrix in machine learning is invaluable. It tells a more complete story, allowing you to calculate key metrics that truly measure performance.
Important Metrics You Can Calculate Using a Confusion Matrix
1. Accuracy Measures the proportion of correct predictions. Formula: (TP + TN) / (TP + FP + FN + TN)
2. Precision Tells you how many of the items predicted as positive are actually positive. Formula: TP / (TP + FP)
3. Recall (Sensitivity) Tells you how good your model is at identifying actual positives. Formula: TP / (TP + FN)
4. F1 Score Balances precision and recall. Useful when you need a single metric to evaluate performance. Formula: 2 * (Precision * Recall) / (Precision + Recall)
5. Specificity Indicates how well your model avoids false positives. Formula: TN / (TN + FP)
6. Misclassification Rate The percentage of total predictions that were wrong. Formula: (FP + FN) / Total Predictions
Each of these metrics reveals a different angle of how your model behaves. Together, they help you decide whether your model is good enough—or needs fine-tuning.
Real-World Example: Medical Diagnosis
Let’s consider a real-life example to make things clearer.
Suppose you’ve built a model to detect a disease. Out of 1000 test results:
From this, it’s clear the model performs well but still misses some actual cases of the disease. In a medical context, that 3% can be crucial. That’s why relying on just accuracy can be risky.
Using the Confusion Matrix in Multi-Class Problems
So far, we’ve looked at binary classification—two possible outcomes. But what if you're building a model to classify images of dogs, cats, and rabbits?
In that case, the confusion matrix expands. Each row still represents the actual class, and each column shows the predicted class. A perfect model would have all predictions along the diagonal. Any value off that diagonal is a misclassification. So if 15 cat images were classified as dogs, it would show up in the corresponding cell.
For students enrolled in a Data Science Course in Noida, working with multi-class classification models often involves real-world datasets like these. And analyzing them with a confusion matrix is a must-have skill.
Why It’s So Essential for Data Science Learners
If you're just stepping into the world of data science, the confusion matrix might feel like just another tool in the toolbox. But the more you explore real-world datasets—customer churn, sentiment analysis, fraud detection—the more you realize how vital this simple chart is.
In any Data Science Course in Noida, whether it’s through classroom exercises or capstone projects, learners are taught to not just build models but to understand them. And that understanding starts with dissecting performance—what’s working, what’s not, and why.
A confusion matrix helps you see past the surface, and that’s what makes a model truly trustworthy.
How to Build and Use a Confusion Matrix (In Practice)
The good news? Building a confusion matrix is straightforward, especially with tools like Python and libraries like scikit-learn.
Step-by-step:
1. Train your model on labeled data.
2. Predict outcomes using your test dataset.
3. Compare predictions with actual values.
4. Use confusion_matrix() from scikit-learn to generate the matrix.
5. Calculate metrics to evaluate performance.
This hands-on process is something every student gets to try when pursuing a Data Science Course in Noida—especially at institutions like AnalytixLabs, which emphasize both theory and practical application.
Common Mistakes to Avoid
Even experienced data scientists can make mistakes when interpreting confusion matrices. Here are a few to watch out for:
Relying solely on accuracy – It can be misleading, especially with skewed data.
Ignoring class imbalance – Always look at recall and precision for each class.
Misinterpreting false positives and negatives – Context matters! In fraud detection, a false negative is riskier than a false positive.
Understanding these nuances helps you make better, data-driven decisions—an essential mindset for any future data scientist.
Conclusion
The confusion matrix in machine learning is more than just a chart. It’s a window into the inner workings of your model. Whether you’re building a spam filter, diagnosing disease, or predicting customer churn, this tool helps you evaluate what your model is truly learning.
For those enrolled in a Data Science Course in Noida, mastering the confusion matrix early on lays the foundation for more complex topics like model tuning, ROC curves, and cost-sensitive learning. It teaches you to go beyond surface-level accuracy and look deeper into model behavior—exactly the kind of insight that separates a good data scientist from a great one.
Frequently Asked Questions (FAQs)
Q1: What is the difference between precision and recall?
A: Precision tells you how many of the predicted positives were actually correct, while recall tells you how many of the actual positives your model successfully identified. Precision focuses on the quality of positive predictions, and recall focuses on the quantity of actual positives detected.
Q2: Can I use the confusion matrix for regression problems?
A: No, the confusion matrix is specifically designed for classification tasks where outcomes are discrete (e.g., spam or not spam, diseased or healthy). For regression, performance metrics like RMSE, MAE, and R² are used instead.
Q3: What is a good F1 Score?
A: A "good" F1 Score depends on your specific problem and tolerance for false positives vs. false negatives. Generally, a higher F1 Score (closer to 1) indicates a better balance between precision and recall. However, the context—such as medical diagnoses or fraud detection—often determines acceptable thresholds.
Q4: How does class imbalance affect the confusion matrix?
A: In imbalanced datasets, where one class dominates, accuracy can be misleading. The confusion matrix exposes this by showing how well the model performs across all classes, especially minority ones. This is why metrics like precision, recall, and F1 Score are crucial.
Q5: Is the confusion matrix useful for multi-class classification?
A: Absolutely! In multi-class problems, the confusion matrix helps visualize where misclassifications are happening between different classes. Each row and column represent actual and predicted classes, respectively, providing a comprehensive performance overview.
Q6: What tools or libraries can generate a confusion matrix in Python?
A: The most commonly used tool is confusion_matrix() from the sklearn.metrics module in scikit-learn. You can also visualize it using ConfusionMatrixDisplay, seaborn.heatmap(), or matplotlib.
Q7: Should I always aim for high accuracy?
A: Not necessarily. Accuracy can be misleading, especially with imbalanced data. Instead, consider the problem context and evaluate using other metrics like precision, recall, F1 Score, and specificity to get a well-rounded understanding of model performance.
Q8: What should I do if my model has high accuracy but low recall?
A: This often indicates that the model is missing a significant number of actual positives. Consider adjusting your decision threshold, balancing the dataset, or using cost-sensitive learning to better capture those important positive cases.
Placed Students
Our Clients
Partners
...
Uncodemy Learning Platform
Uncodemy Free Premium Features
Smart Learning System
Personalized learning paths with interactive materials and progress tracking for optimal learning experience.