The importance of mastering data structures cannot be overstated in today's technology-driven landscape. Companies across various industries actively seek professionals who demonstrate strong foundational knowledge in data structures and algorithms. This comprehensive guide explores the fascinating world of data structure diagrams, providing students with essential insights that will enhance their programming capabilities and prepare them for successful careers in software development.
What Are Data Structure Diagrams?
Data structure diagrams represent visual blueprints that illustrate how data elements are organized, stored, and accessed within computer memory. These diagrams serve as roadmaps for programmers, showing the relationships between different data elements and the operations that can be performed on them. By translating complex programming concepts into visual formats, these diagrams enable students to understand intricate data relationships more effectively.
The beauty of data structure diagrams lies in their ability to simplify complicated programming concepts. When students encounter abstract ideas like linked lists, trees, or graphs, visual representations help bridge the gap between theoretical knowledge and practical implementation. These diagrams act as learning aids that make programming education more engaging and accessible to learners from diverse educational backgrounds.
Modern programming education increasingly relies on visual learning techniques, recognizing that different students learn more effectively through various methods. Data structure diagrams cater to visual learners while simultaneously providing concrete examples that benefit all learning styles. This approach has revolutionized how programming concepts are taught and understood in educational institutions worldwide.
Types of Data Structure Diagrams
Linear Data Structure Diagrams
Linear data structures organize elements in sequential arrangements, making them ideal for beginners to understand fundamental programming concepts. Array diagrams represent the simplest form of linear data structures, showing elements stored in contiguous memory locations with indexed access patterns. These diagrams typically display rectangular boxes containing data values, with arrows indicating memory addresses or index positions.
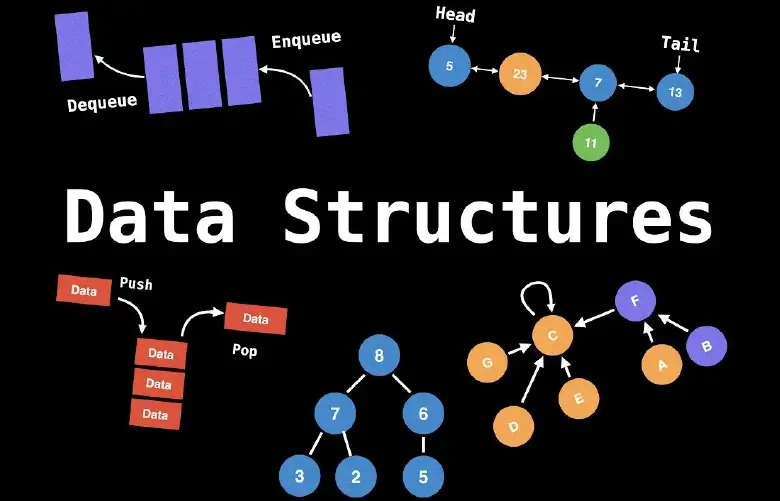
Stack diagrams illustrate the Last-In-First-Out (LIFO) principle through vertical representations where elements are added and removed from the top. These visual representations help students understand stack operations like push, pop, and peek through clear graphical illustrations. The diagrams often include pointers indicating the top of the stack and show the dynamic nature of stack operations.
Queue diagrams demonstrate the First-In-First-Out (FIFO) principle through horizontal or circular representations. These diagrams show elements entering from one end (rear) and leaving from the other end (front), making it easy for students to visualize queue operations. Circular queue diagrams particularly help students understand how memory space can be efficiently utilized through wraparound mechanisms.
Linked list diagrams showcase the dynamic nature of memory allocation through nodes connected by pointers. These diagrams display individual nodes containing data and address fields, with arrows representing pointer connections. Single, double, and circular linked list variations each have distinct diagrammatic representations that highlight their unique characteristics and operational capabilities.
Non-Linear Data Structure Diagrams
Tree diagrams represent hierarchical data structures through parent-child relationships, making them essential for understanding various tree-based algorithms and applications. Binary tree diagrams show nodes with at most two children, typically arranged in a structured format that clearly displays parent-child relationships. These diagrams help students visualize tree traversal methods like inorder, preorder, and postorder traversals.
Binary search tree diagrams maintain specific ordering properties, with left subtrees containing smaller values and right subtrees containing larger values. These visual representations help students understand how search, insertion, and deletion operations maintain the tree's structural integrity while optimizing search performance.
Graph diagrams represent the most complex data structures, showing vertices connected by edges to model various real-world relationships. These diagrams can represent directed or undirected graphs, weighted or unweighted connections, and various graph algorithms like breadth-first search, depth-first search, and shortest path algorithms. The visual nature of graph diagrams makes complex algorithmic concepts more accessible to students.
Hash table diagrams illustrate how data is distributed across memory locations using hash functions. These diagrams show the relationship between keys, hash functions, and storage locations, helping students understand collision resolution techniques and load factor considerations. Visual representations of chaining and open addressing methods make these concepts clearer for learners.
Benefits of Using Data Structure Diagrams
Enhanced Learning Experience
Data structure diagrams significantly improve the learning experience by providing visual context to abstract programming concepts. Students who struggle with textual explanations often find visual representations more intuitive and easier to understand. These diagrams create mental models that help students remember and apply data structure concepts in practical programming scenarios.
The visual nature of these diagrams supports different learning styles, making programming education more inclusive and effective. Visual learners particularly benefit from seeing data relationships represented graphically, while kinesthetic learners can trace through operations using the visual guides. This multi-modal approach ensures that students with various learning preferences can successfully grasp complex programming concepts.
Diagrams also facilitate better retention of information by creating memorable visual associations. When students visualize how data moves through different structures, they develop stronger cognitive connections that improve long-term memory and recall. This enhanced retention translates into better performance in programming assignments and technical interviews.
Problem-Solving Skills Development
Data structure diagrams serve as powerful problem-solving tools that help students approach programming challenges systematically. By sketching out data relationships and operations, students can better understand problem requirements and design appropriate solutions. This visual problem-solving approach reduces errors and improves code quality.
The process of creating diagrams encourages students to think through problems step by step, promoting analytical thinking skills that extend beyond programming. Students learn to break down complex problems into manageable components, identify patterns, and develop logical solution strategies. These skills prove invaluable in professional software development environments.
Diagrams also help students debug their programs more effectively by providing visual representations of expected data flow and structure. When programs produce unexpected results, students can trace through their diagrams to identify logical errors and implement corrections more efficiently.
Professional Development
Understanding data structure diagrams prepares students for professional software development roles where visual documentation and system design are essential skills. Many companies use diagrammatic representations in their development processes, making this knowledge directly applicable to workplace scenarios.
Technical interviews often include questions about data structures where candidates must explain concepts using visual aids. Students who are comfortable with data structure diagrams demonstrate stronger communication skills and technical understanding, giving them competitive advantages in job markets.
The ability to create and interpret data structure diagrams also facilitates better collaboration with team members, technical leads, and stakeholders. Clear visual communication reduces misunderstandings and improves project outcomes in professional development environments.
Applications in Real-World Programming
Data structure diagrams find extensive applications in various programming domains, from web development to artificial intelligence. Database design relies heavily on entity-relationship diagrams that share many characteristics with data structure diagrams. Understanding these visual representations helps students transition more easily into database administration and design roles.
Web development frameworks often use data structures for managing application state, routing, and user interface components. Students who understand data structure diagrams can better comprehend framework architectures and make informed decisions about implementation strategies. This knowledge proves particularly valuable when working with modern JavaScript frameworks and state management libraries.
Game development extensively uses data structures for managing game objects, collision detection, and pathfinding algorithms. Tree structures represent scene graphs, while graph structures model game worlds and navigation systems. Students with strong data structure visualization skills find game development concepts more accessible and engaging.
Machine learning and artificial intelligence applications rely on complex data structures for representing knowledge, decision trees, and neural networks. Data structure diagrams help students understand how these algorithms process information and make decisions, preparing them for careers in emerging technology fields.
Learning Data Structures with Uncodemy
Uncodemy recognizes the critical importance of data structures in programming education and offers comprehensive courses designed to build strong foundational knowledge. The platform's Data Structures and Algorithms course provides students with extensive hands-on experience in creating, implementing, and visualizing various data structures through practical projects and assignments.
The course curriculum includes detailed coverage of all major data structure types, from basic arrays and linked lists to advanced trees and graphs. Students learn to create their own diagrams and interpret existing ones, developing skills that directly translate to professional development environments. Interactive exercises and visual learning tools make complex concepts accessible to learners at all levels.
Uncodemy's approach emphasizes practical application alongside theoretical understanding, ensuring students can implement data structures in real programming projects. The course includes industry-relevant examples and case studies that demonstrate how data structures solve actual business problems. This practical focus prepares students for immediate contribution in professional development roles.
Experienced instructors guide students through the learning process, providing personalized feedback and support. The collaborative learning environment encourages students to share diagrams, discuss approaches, and learn from each other's perspectives. This community-based learning approach enhances understanding and builds professional networking opportunities.
Advanced Diagram Techniques
Modern data structure education incorporates sophisticated visualization techniques that go beyond traditional static diagrams. Interactive diagrams allow students to manipulate data structures in real-time, observing how operations affect structure and performance. These dynamic visualizations provide deeper insights into algorithmic behavior and complexity analysis.
Animation techniques show data structure operations step by step, helping students understand the temporal aspects of algorithms. Students can observe how insertion, deletion, and search operations progress through different data structures, building intuitive understanding of algorithmic efficiency and optimization opportunities.
Color coding and annotation systems enhance diagram readability and highlight important structural relationships. These techniques help students focus on specific aspects of data structures while maintaining awareness of overall organizational patterns. Advanced diagramming tools provide features that support collaborative learning and professional documentation standards.
Future Trends and Technologies
The field of data structure visualization continues evolving with advances in educational technology and interactive learning platforms. Virtual and augmented reality applications promise to create immersive learning experiences where students can explore three-dimensional data structures and algorithms. These technologies will make abstract programming concepts even more tangible and engaging.
Artificial intelligence integration in educational platforms enables personalized diagram generation and adaptive learning experiences. Students receive customized visual representations based on their learning progress and preferred visualization styles. This personalization improves learning outcomes and maintains student engagement throughout the educational process.
Cloud-based collaboration tools facilitate real-time diagram sharing and collaborative problem-solving among students and instructors. These platforms support remote learning environments while maintaining the interactive and collaborative aspects essential for effective programming education.
Conclusion
Data structure diagrams represent essential tools for anyone serious about pursuing a career in software development or computer science. These visual representations transform complex programming concepts into accessible, understandable formats that support effective learning and professional development. Students who master data structure visualization techniques gain significant advantages in both academic and professional contexts.
The investment in understanding data structure diagrams pays dividends throughout a programmer's career, from initial learning phases through advanced system design and architecture roles. These skills enable better communication, more effective problem-solving, and deeper understanding of computational efficiency and optimization principles.
Uncodemy's comprehensive approach to data structure education ensures students receive the theoretical knowledge, practical skills, and visual understanding necessary for success in modern programming careers. The platform's emphasis on hands-on learning and industry-relevant applications prepares students for immediate contribution in professional development environments.
As technology continues advancing and programming becomes increasingly complex, the ability to visualize and communicate data relationships becomes even more valuable. Students who develop these skills early in their careers position themselves for long-term success in the ever-evolving technology landscape. Data structure diagrams serve as the foundation for this essential skill development, making them indispensable components of modern programming education.