In this article, we will walk through what makes a good IoT dashboard, explore the design principles behind it, look at the technologies you can use, and even create a basic sample with JavaScript and chart libraries.
By the end, you will understand how to conceptualize, design, and implement an IoT dashboard that provides clarity and control.
Why IoT Dashboards Matter
IoT devices range from fitness trackers and smart thermostats to industrial machines in factories. Each of these devices produces streams of data such as temperature readings, energy usage, or location updates. Without a dashboard, this data remains inaccessible and often overwhelming.
A well designed IoT dashboard:
- Provides real time visibility into connected devices.
- Helps identify anomalies like unusual temperature spikes or machine downtime.
- Supports decision making by highlighting trends and patterns.
- Improves user experience by simplifying complex information into visuals.
- Enhances security monitoring by tracking access and unusual activity.
Imagine managing hundreds of smart meters across a city. Without a dashboard, you would have to sift through endless logs. With a dashboard, you see energy usage trends instantly in charts and alerts.
Key Features of an IoT Dashboard
When designing an IoT monitoring dashboard, certain features are essential:
- Device Overview
A high level summary showing all devices, their status (online or offline), and health metrics.
- Real Time Data Updates
IoT devices push continuous data. The dashboard should refresh dynamically without manual reloads.
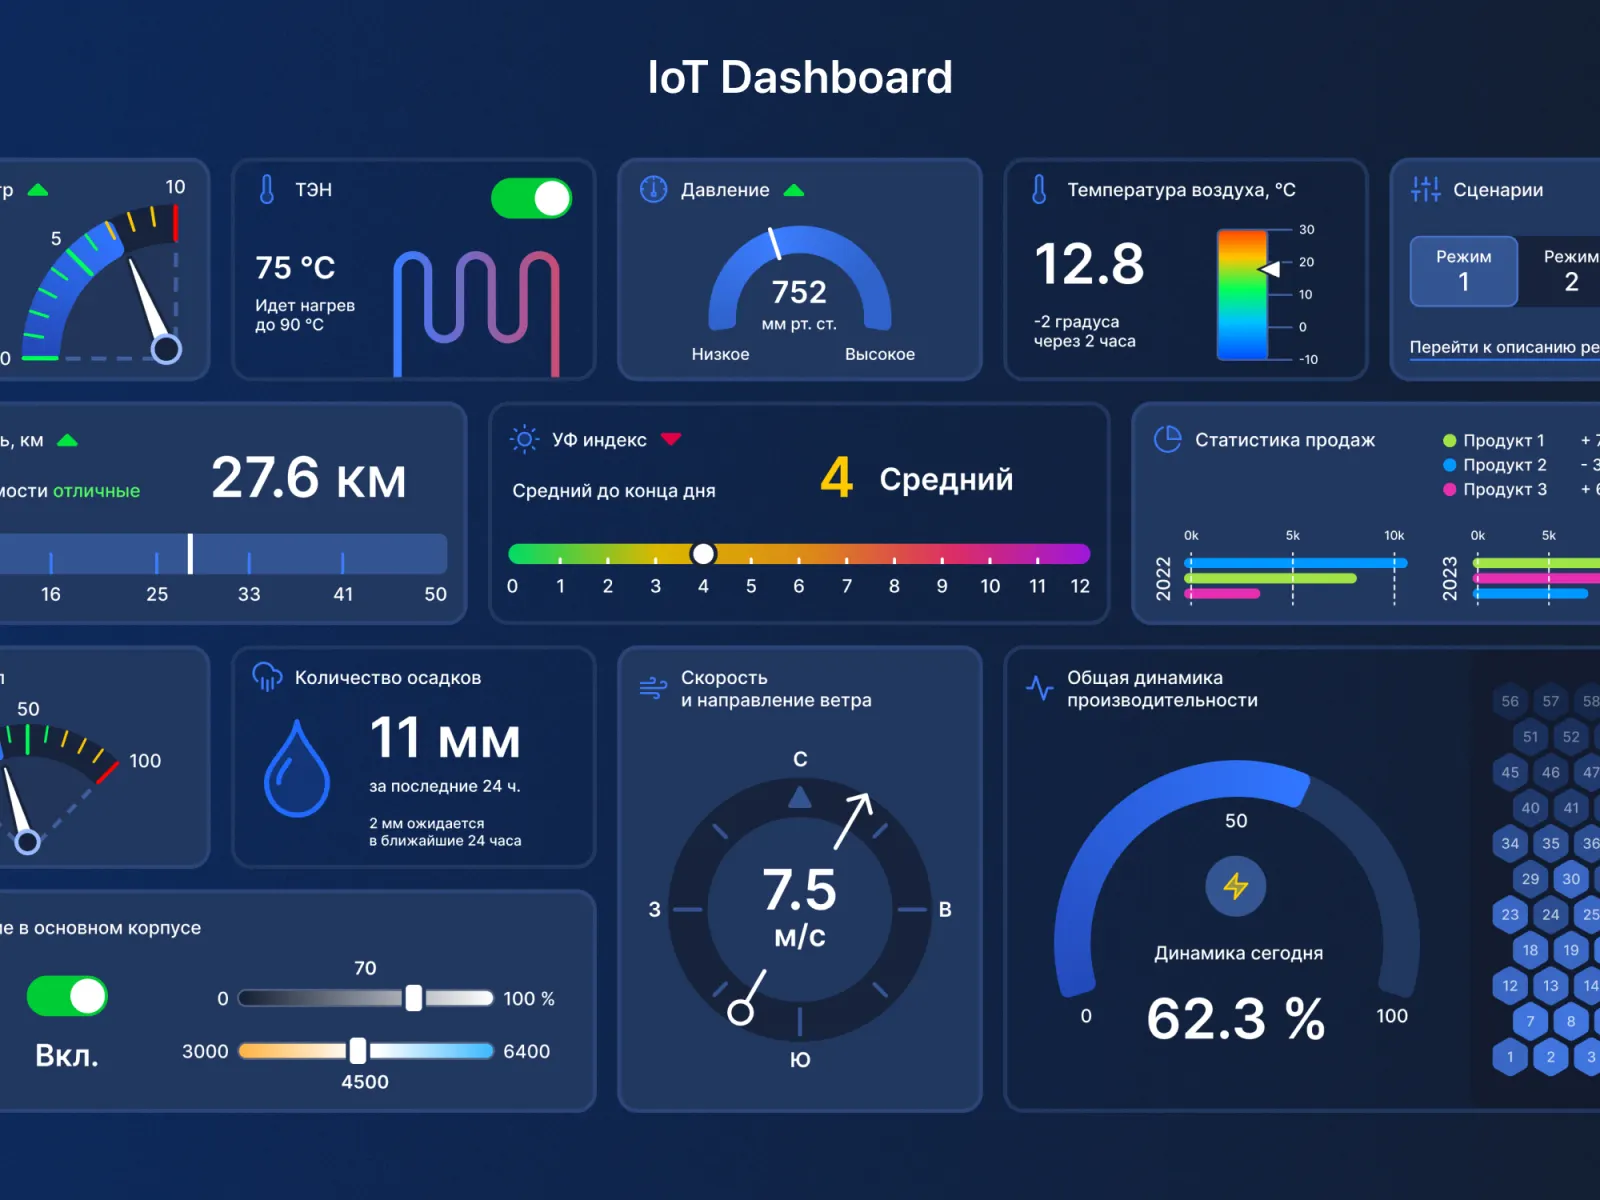
- Charts and Visualizations
Line charts for time series data, bar charts for comparisons, and pie charts for distribution make data intuitive.
- Customizable Views
Users should be able to filter by device type, time range, or location.
- Alerts and Notifications
If a device exceeds a safe temperature, the dashboard should highlight it or send a push notification.
- Security and Access Control
Sensitive IoT data must be protected with login systems and role based access.
- Historical Data Analysis
Beyond real time monitoring, dashboards should allow users to review past data for trends.
Principles of Designing an Effective IoT Dashboard
Design is not just about aesthetics—it is about usability. Here are principles to follow:
- Simplicity First
Avoid clutter. Display only the most important information on the main screen. Advanced metrics can be tucked into secondary views.
- Consistency
Use consistent colors and layouts. For example, green should always mean healthy and red should always mean critical.
- Responsiveness
IoT dashboards should work across desktops, tablets, and even smartphones.
- User Centric Design
A factory manager will need different information than a homeowner. Design dashboards tailored to the target user.
- Scalability
Start small but ensure the design can handle hundreds or thousands of devices as the system grows.
Technology Stack for Building IoT Dashboards
To build an IoT dashboard, you need technologies that handle device data, real time updates, and visualization.
- Frontend: JavaScript, React, Vue, or Angular for interactive interfaces.
- Charts: Libraries like Chart.js, D3.js, or Recharts.
- Backend: Node.js, Python Flask, or Django to manage data flow.
- Database: MongoDB or InfluxDB for storing time series IoT data.
- Real Time Communication: WebSockets or MQTT for pushing updates.
- Cloud Integration: AWS IoT, Azure IoT Hub, or Google Cloud IoT for scalability.
Sample Implementation: JavaScript IoT Dashboard
Let us walk through a simple example of an IoT dashboard using JavaScript and Chart.js. This example simulates device temperature data updating in real time.
HTML Structure
Copy Code
<!DOCTYPE html>

<html>

<head>

  <title>IoT Dashboard</title>

  <script src="https://cdn.jsdelivr.net/npm/chart.js"></script>

</head>

<body>

  <h2>IoT Device Monitoring Dashboard</h2>

  <canvas id="temperatureChart" width="600" height="400"></canvas>

  <script src="app.js"></script>

</body>

</html>
JavaScript for Real Time Updates
Copy Code
const ctx = document.getElementById('temperatureChart').getContext('2d');

const data = {

  labels: [],

  datasets: [{

    label: 'Temperature (°C)',

    data: [],

    borderColor: 'red',

    fill: false,

    tension: 0.1

  }]

};


const config = {

  type: 'line',

  data: data,

  options: {

    responsive: true,

    scales: {

      x: { title: { display: true, text: 'Time' }},

      y: { title: { display: true, text: 'Temperature (°C)' }}

    }

  }

};


const temperatureChart = new Chart(ctx, config);

function simulateDeviceData() {

  const now = new Date().toLocaleTimeString();

  const newTemp = Math.floor(Math.random() * (40 - 20) + 20);

  data.labels.push(now);

  data.datasets[0].data.push(newTemp);

  if (data.labels.length > 10) {

    data.labels.shift();

    data.datasets[0].data.shift();

  }

  temperatureChart.update();

}

setInterval(simulateDeviceData, 2000);
This simple dashboard simulates a device sending temperature updates every 2 seconds. The chart dynamically reflects new data points, mimicking real IoT behavior.
Real World Use Cases
IoT dashboards are not just theoretical—they are actively used across industries.
- Smart Homes
Homeowners monitor energy usage, security cameras, and climate control from one dashboard.
- Healthcare
Doctors track patient vitals from wearable IoT devices on a secure dashboard.
- Manufacturing
Plant managers oversee machine performance, downtime, and predictive maintenance alerts.
- Agriculture
Farmers monitor soil moisture, weather, and crop health to optimize irrigation.
- Logistics and Transportation
Companies track fleet locations, fuel efficiency, and delivery times.
Challenges in Designing IoT Dashboards
While dashboards are powerful, they come with challenges:
- Data Overload: Too much information can overwhelm users. Prioritization is key.
- Scalability: Handling thousands of devices in real time requires efficient backend design.
- Latency: Any delay in updating can compromise decision making.
- Security: IoT devices are vulnerable to attacks, and dashboards must safeguard sensitive data.
- Integration: Different IoT devices may use different protocols, requiring middleware solutions.
Best Practices for IoT Dashboards
- Use Color Coding for quick interpretation of device states.
- Offer Drill Down Views so users can move from overview to detailed device metrics.
- Provide Export Options like CSV or PDF for reporting.
- Enable Mobile Access for users on the go.
- Test with Real Users to ensure the dashboard meets actual needs.
Future Trends in IoT Dashboards
The future of IoT dashboards is exciting:
- AI Integration: Dashboards will use AI to predict anomalies before they occur.
- Voice Control: Users may ask dashboards for updates via voice assistants.
- Augmented Reality Dashboards: Wearable devices could overlay IoT data directly in physical spaces.
- Blockchain Security: Distributed ledgers will improve data integrity.
Learning with Uncodemy
If you are interested in building real world IoT dashboards, you should explore Uncodemy’s IoT and Full Stack Development Courses in Noida. These courses guide you through:
- Basics of IoT devices and data communication.
- Building web applications using JavaScript frameworks.
- Implementing real time dashboards with charts and APIs.
- Security and scalability for enterprise level IoT systems.
Uncodemy’s project based teaching ensures you not only learn concepts but also apply them in hands on projects.
Conclusion
Designing a dashboard for monitoring IoT devices is about balancing data, design, and user needs. From showing real time updates to enabling predictive insights, dashboards transform raw IoT data into decisions. With tools like JavaScript, Chart.js, and cloud services, even beginners can start building simple dashboards.
As IoT grows, dashboards will only become more critical. By following best practices, embracing new technologies, and learning from platforms like Uncodemy, you can create dashboards that empower businesses and individuals to harness the full power of IoT.