Examples of Parametric and Non-Parametric Tests in Statistics
Mr. Bambam Yadav / 1 days - 0
- 4 min read
Understanding Parametric Tests
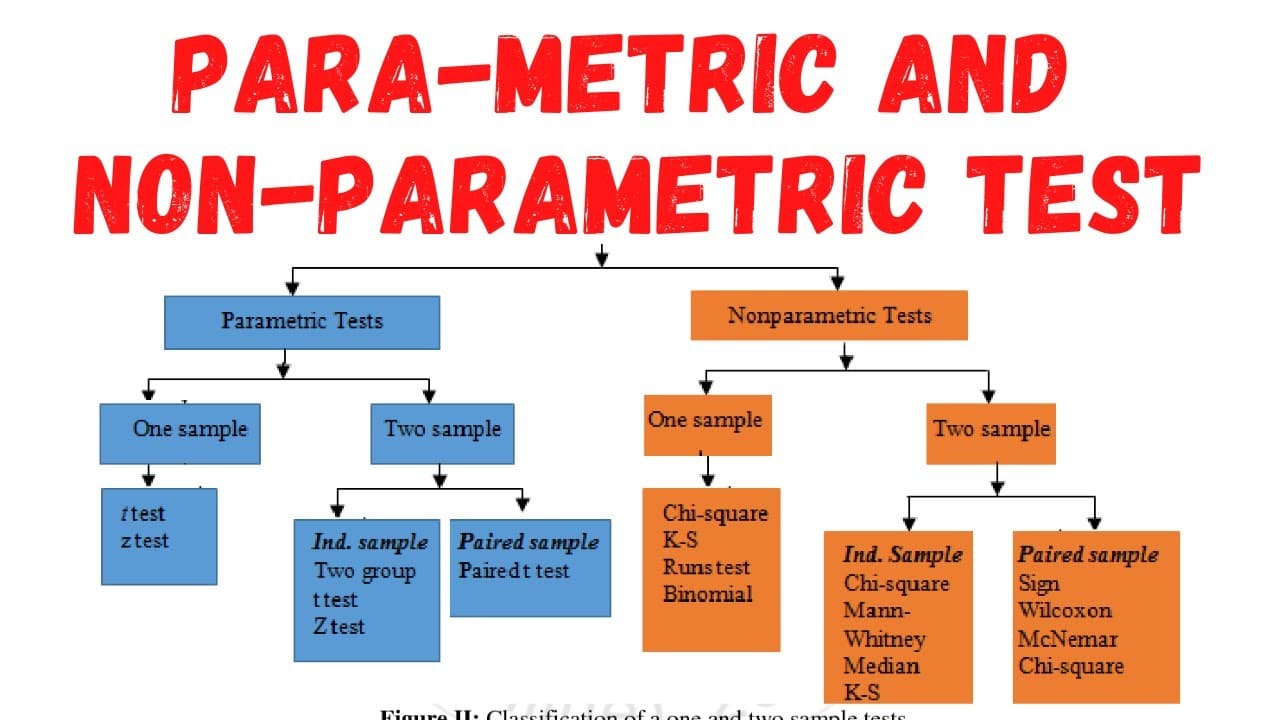
Parametric tests are statistical tests that rely on certain assumptions about the population from which the sample is drawn. These assumptions typically include normal distribution of data, homogeneity of variance, and the use of interval or ratio scale measurements. Because parametric tests make these assumptions, they are generally more powerful and precise when the assumptions hold true.
Common examples of parametric tests include thet-test, analysis of variance (ANOVA), Pearson’s correlation, and linear regression. Students in a Data Science Course in Noida frequently use these tests when analyzing continuous numerical data and when they can reasonably assume that the data follows a specific distribution.
Let us now explore several key parametric tests and their applications.
T-Test
The t-testis perhaps one of the most widely used parametric tests. It is designed to compare the means of two groups to determine whether there is a statistically significant difference between them. There are several variations of the t-test:
- Independent samples t-test, used when comparing the means of two independent groups (e.g., test scores of two different classes).
- Paired samples t-test, used when comparing two related groups (e.g., before-and-after scores from the same group of students).
- One-sample t-test, used when comparing the mean of a single sample to a known population mean.
These tests assume that the data is normally distributed and that variances are equal across groups. In practice, data scientists apply t-tests in A/B testing, clinical trials, and experimental research to evaluate interventions or treatments.
Analysis of Variance (ANOVA)
ANOVAextends the t-test by allowing comparisons across more than two groups. Instead of comparing just two means, ANOVA compares the means of three or more groups to determine if at least one group mean is significantly different from the others.
There are several types of ANOVA, including one-way ANOVA (for one independent variable) and two-way ANOVA (for two independent variables). ANOVA assumes normality, homogeneity of variances, and independence of observations.
In the context of aData Science Course in Noida, ANOVA is often introduced when students work on projects involving multi-group comparisons, such as comparing customer satisfaction across multiple service branches or analyzing sales performance across product categories.
Pearson’s Correlation
Pearson’s correlation coefficient measures the strength and direction of the linear relationship between two continuous variables. It ranges from -1 (perfect negative correlation) to +1 (perfect positive correlation), with 0 indicating no correlation.
This test assumes that the relationship between variables is linear and that both variables are normally distributed. Pearson’s correlation is frequently used in data science to explore relationships between predictors and outcomes, such as the correlation between marketing spend and sales revenue.
Linear Regression
Linear regression is another important parametric technique used to model the relationship between a dependent variable and one or more independent variables. Simple linear regression involves one predictor, while multiple linear regression involves several predictors.
Linear regression assumes linearity, normality of residuals, homoscedasticity (constant variance), and independence. In practice, data scientists apply regression models to predict outcomes, identify trends, and make data-driven decisions.
For students enrolled in aData Science Course in Noida, learning parametric tests forms the backbone of inferential statistics, equipping them with tools to analyze real-world problems using structured, assumption-based models.
Understanding Non-Parametric Tests
Non-parametric tests, in contrast, do not require the data to follow a specific distribution. These tests are often called “distribution-free” because they make fewer assumptions about the underlying data. Non-parametric tests are especially useful when dealing with ordinal data, ranked data, small sample sizes, or data that violates the assumptions required for parametric tests.
Some widely used examples of parametric and non parametric test include the Mann-Whitney U test, Wilcoxon signed-rank test, Kruskal-Wallis test, Spearman’s rank correlation, and Chi-square test. Non-parametric tests are generally more robust but less powerful than parametric tests because they use less information about the data.
Let us explore several key non-parametric tests and their applications.
Mann-Whitney U Test
The Mann-Whitney U test(also called the Wilcoxon rank-sum test) is used to compare the distributions of two independent groups. It serves as the non-parametric alternative to the independent samples t-test when the assumptions of normality or homogeneity of variance are violated.
For example, if a data scientist wants to compare customer satisfaction ratings between two service centers, and the data is ordinal or not normally distributed, the Mann-Whitney U test would be an appropriate choice.
Wilcoxon Signed-Rank Test
The Wilcoxon signed-rank test is the non-parametric counterpart to the paired samples t-test. It is used to compare two related groups when the data is not normally distributed. This test evaluates whether the median difference between paired observations is zero.
An example of its application might involve evaluating the impact of a new user interface by comparing user satisfaction before and after implementation, when the satisfaction ratings are ordinal or skewed.
Kruskal-Wallis Test
The Kruskal-Wallis testis the non-parametric equivalent of one-way ANOVA. It allows comparison of the distributions of three or more independent groups when the assumptions for ANOVA are not met.
Data scientists might use the Kruskal-Wallis test to compare median customer ratings across multiple product lines when the data is non-normal or when outliers are present.
Spearman’s Rank Correlation
Spearman’s rank correlation measures the strength and direction of the monotonic relationship between two ranked variables. It serves as a non-parametric alternative to Pearson’s correlation, particularly when the relationship is non-linear or when the variables are ordinal.
For example, Spearman’s rank correlation can be used to examine the relationship between employee satisfaction rankings and performance ratings.
Chi-Square Test
The Chi-square test is a widely used non-parametric test to evaluate the association between categorical variables. There are two main types: the Chi-square test of independence (to assess relationships between two categorical variables) and the Chi-square goodness-of-fit test(to assess whether observed frequencies match expected frequencies).
Applications include evaluating whether customer preferences differ by region or determining whether website click-through rates are independent of device type.
In aData Science Course in Noida, students often explore non-parametric tests when working with messy, real-world data where ideal assumptions rarely hold.
Choosing Between Parametric and Non-Parametric Tests
A common question for students is: when should one use parametric versus non-parametric tests? The answer largely depends on the data and the research question.
Parametric tests should be used when the data meets the necessary assumptions (normality, homogeneity of variance, interval or ratio scale), as they tend to be more powerful and precise. However, when the assumptions are violated — for example, with skewed data, ordinal data, or small sample sizes — non-parametric tests offer a more robust alternative.
Students in a Data Science Course in Noida learn to perform diagnostic checks, such as normality tests (e.g., Shapiro-Wilk, Kolmogorov-Smirnov), variance homogeneity tests (e.g., Levene’s test), and visual inspections (e.g., histograms, Q-Q plots), to guide their choice of statistical tests.
Understanding both categories is essential because real-world datasets are often messy, complex, and non-ideal. A flexible data scientist knows how to adapt to different data conditions, ensuring valid and reliable results.
Applications in Real-World Data Science
The knowledge of examples of parametric and non parametric test has direct applications in the practice of data science. In business, parametric tests are frequently used in controlled experiments (such as A/B testing), product development, and financial forecasting. Non-parametric tests come into play when analyzing customer feedback, survey responses, or categorical data, where normality cannot be assumed.
In healthcare analytics, parametric models are used to predict outcomes or assess treatment effects, while non-parametric methods handle small clinical trials, ordinal symptom ratings, or genetic data analysis. In social sciences, parametric and non-parametric tests are both employed to study human behavior, societal trends, and psychological phenomena.
For students enrolled in a Data Science Course in Noida, learning these tests is not just a theoretical exercise. Through projects, case studies, and hands-on coding assignments, they gain practical experience applying these methods to real datasets, making them better prepared for the challenges of a data-driven career.
Limitations and Considerations
Despite their importance, both parametric and non-parametric tests have limitations. Parametric tests can be misleading if assumptions are violated, leading to inaccurate p-values or confidence intervals. Non-parametric tests, while more robust, can be less sensitive, potentially missing subtle effects in the data.
Moreover, many non-parametric tests rely on rankings rather than actual values, which means they lose some information in the process. As a result, data scientists must carefully weigh the trade-offs, conduct assumption checks, and interpret results cautiously.
In advanced analytics, hybrid approaches and resampling methods, such as bootstrapping or permutation tests, can provide alternatives when neither parametric nor traditional non-parametric tests suffice.
Conclusion
Mastering both parametric and non-parametric tests is a critical skill for anyone pursuing a career in data science or analytics. For students undertaking a Data Science Course in Noida, understanding the examples of parametric and non parametric testequips them with a versatile toolkit for handling diverse datasets, answering complex research questions, and delivering meaningful insights.
Whether analyzing marketing campaigns, evaluating healthcare interventions, or conducting social research, the thoughtful application of statistical tests ensures that decisions are grounded in evidence, not guesswork. By developing both theoretical knowledge and practical experience, students position themselves as capable, adaptable professionals in the ever-evolving world of data science.


