This article offers you a detailed, easy-to-follow beginner’s guide to learning R — a language specifically designed for statistical computing and graphics. Whether you are a student just starting out, a working professional transitioning into data roles, or a researcher looking to analyze your data more effectively, this tutorial will help you understand not only how R works but also why it’s such a valuable tool in the modern data science landscape.
We will walk you through the essential steps: from understanding what R is, setting up your environment, learning the syntax, and working with data, to performing basic analyses and visualizations. By the end, you’ll have a solid roadmap to continue learning and applying R confidently.
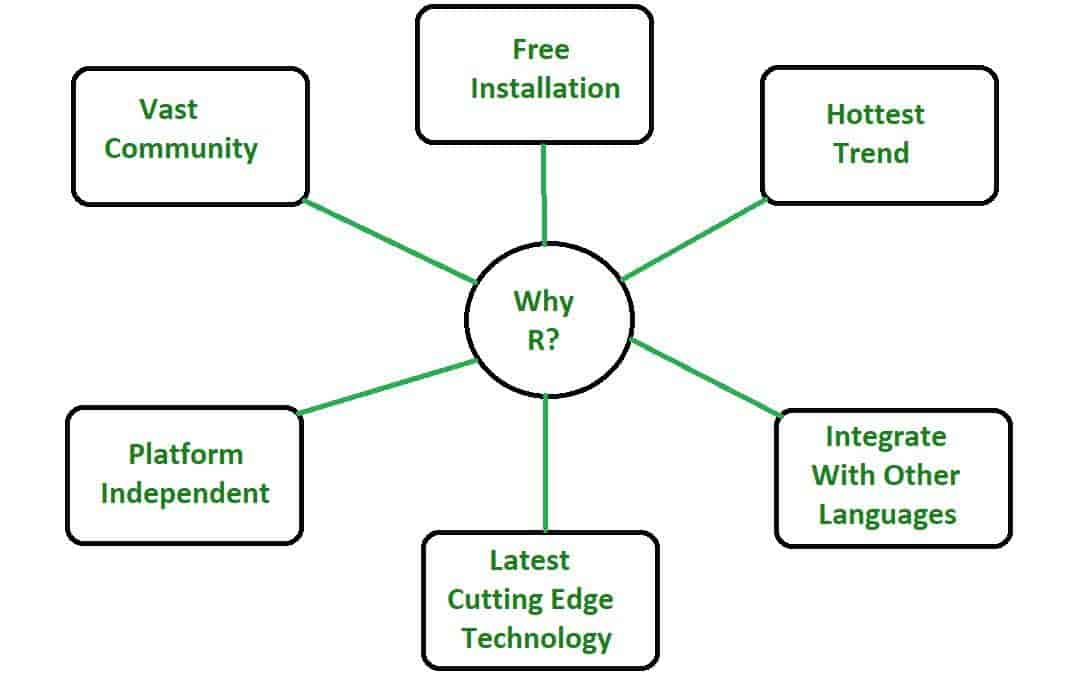
Why Learn R?
Before diving into the R scripting language tutorial, let’s understand why you should invest time learning R.
R is one of the most widely used languages in data science, statistics, and academic research. Developed in the early 1990s, R has gained popularity for its ability to handle complex statistical operations, create high-quality visualizations, and support a wide range of data analysis tasks. It’s open-source, meaning it’s free to use and has a massive community contributing packages, tools, and updates.
If you’re part of a Data Science Course in Noida, you’ll likely encounter R alongside Python, SQL, and other core technologies. Many students wonder: should I learn both Python and R? The answer is yes — they complement each other. While Python is known for machine learning and general-purpose programming, R shines in statistical analysis, exploratory data analysis (EDA), and visualization. Knowing both makes you a versatile data scientist.
Step 1: Setting Up Your R Environment
The first step in any R scripting language tutorial is setting up your system.
To begin, you need two core components:
1. R — the base programming language, which you can download from the Comprehensive R Archive Network (CRAN) at.
2. RStudio — a powerful integrated development environment (IDE) for R, which makes writing and running R scripts much easier. Download it from.
Once installed, open RStudio. You’ll notice four main panels:
- Console (bottom left): where you run R commands.
- Source (top left): where you write and save scripts.
- Environment/History (top right): where variables and past commands appear.
- Files/Plots/Packages/Help (bottom right): where you manage files, view plots, load packages, and search documentation.
Get familiar with the interface. A comfortable development environment will make your learning process smoother.
Step 2: Understanding Basic R Syntax
Next, let’s dive into some basic R syntax.
R, like any language, has its own rules and structure. Here are some key components you need to know:
Assigning values:
Use the <- operator or = to assign values.
x <- 5
y = 10
Printing output:
You can display a value by simply typing the variable name or using print().
print(x)
x
Comments:
Use # to add comments.
# This is a comment
Vectors:
Create a sequence of data using c().
numbers <- c(1, 2, 3, 4, 5)
Data types:
R has various data types, including numeric, character, logical, and complex.
num <- 10 # numeric
name <- "John" # character
flag <- TRUE # logical
Spend time practicing these small snippets — it will help you get familiar with R’s style.
Step 3: Working with Data
Since R is designed for data work, you’ll soon want to import, explore, and manipulate datasets.
Importing data:
R can read data from CSV, Excel, databases, or online sources.
data <- read.csv("data.csv")
Exploring data:
Use functions like head(), tail(), summary(), and str() to inspect your data.
head(data)
summary(data)
str(data)
Selecting data:
You can access specific columns or rows.
data$column_name # select a column
data[1:5, ] # select first five rows
data[data$age > 30, ] # filter rows
If you’re following a Data Science Course in Noida, you’ll practice working with real datasets, such as customer transactions, health records, or sales data. The ability to quickly explore and clean this data is critical for analysis.
Step 4: Manipulating Data with dplyr
While base R offers many tools, one of the most popular packages for data manipulation is dplyr. It provides a clean, intuitive syntax for working with data frames.
First, install and load the package:
install.packages("dplyr")
library(dplyr)
Key functions you’ll use:
- select() — pick columns
- filter() — filter rows
- mutate() — create new columns
- summarise() — summarize data
- group_by() — group data
Example:
library(dplyr)
data %>%
filter(age > 30) %>%
group_by(gender) %>%
summarise(average_income = mean(income))
This “pipe” (%>%) structure makes your code more readable and efficient. Learning dplyr early on will make your R scripts significantly cleaner.
Step 5: Visualizing Data with ggplot2
Data visualization is one of R’s strongest features. The ggplot2 package is the gold standard for creating stunning, customizable graphics.
Install and load ggplot2:
install.packages("ggplot2")
library(ggplot2)
Basic example:
ggplot(data, aes(x = age, y = income)) +
geom_point()
This creates a scatter plot of age vs. income. You can easily customize the plot by adding layers, themes, and labels.
For example, adding color and title:
ggplot(data, aes(x = age, y = income, color = gender)) +
geom_point() +
labs(title = "Income by Age and Gender")
Practicing data visualization will not only make your reports more engaging but also help you understand patterns and insights more effectively.
Step 6: Writing Your Own Functions
Once you’re comfortable with the basics, you’ll want to write your own functions to automate repetitive tasks.
Example:
calculate_mean <- function(x) {
mean(x, na.rm = TRUE)
}
calculate_mean(data$income)
This simple function calculates the mean of a variable, ignoring missing values (NA). Functions help make your code modular, reusable, and easier to debug.
Step 7: Understanding Statistical Analysis in R
R’s biggest strength lies in statistics. Whether you’re running basic tests or advanced models, R has you covered.
Descriptive statistics:
mean(data$income)
sd(data$income)
summary(data)
Linear regression:
model <- lm(income ~ age + education, data = data)
summary(model)
Hypothesis testing:
t.test(data$income ~ data$gender)
If you’re enrolled in a Data Science Course in Noida, you’ll likely explore these topics in more depth, applying them to real-world datasets and learning how to interpret the results.
Step 8: Managing Packages and Help Resources
R’s ecosystem is powered by packages — extensions that add new functions and capabilities. Learning how to manage them is critical.
Install a package:
install.packages("package_name")
Load a package:
library(package_name)
Get help:
?function_name
help(package = "package_name")
Step 9: Best Practices for R Beginners
To succeed in learning R, follow these best practices:
- Write clean, well-commented code.
- Start small and gradually tackle larger projects.
- Explore sample datasets like mtcars, iris, or gapminder.
- Regularly practice — even short daily exercises improve retention.
- Join online communities such as Stack Overflow or RStudio Community.
- Work on real projects, such as analyzing survey data, building dashboards, or conducting statistical experiments.
If you’re attending a Data Science Course in Noida, leverage mentorship and peer support to troubleshoot problems and gain insights.
Step 10: Building Your First R Project
Now that you know the basics, it’s time to put everything together in a beginner-friendly project. Here’s a simple project idea:
Project: Analyze Customer Spending Patterns
1. Objective: Understand what factors influence customer spending
2. Data: Import a customer transactions dataset.
3. Tasks:
- Clean and preprocess the data.
- Calculate key metrics like average spending.
- Visualize spending by customer segments (age, gender, location).
- Build a linear regression model to predict spending.
By the end, you will have used R for data import, cleaning, exploration, visualization, and modeling — covering the full data analysis pipeline.
Conclusion
Learning R might feel intimidating at first, but by following a structured, step-by-step approach, you’ll quickly gain confidence. Remember: no one masters a programming language overnight. Consistent practice, small wins, and real-world projects are what lead to long-term success.
If you’re currently enrolled in a Data Science Course in Noida, use the resources, projects, and mentorship available to deepen your understanding of R. Explore additional learning resources such as online tutorials, documentation, and community forums to keep expanding your knowledge.
R is not just a programming language — it’s a powerful tool that, once mastered, can open doors to data analysis, research, machine learning, and more. Start your journey today, one script at a time.