Top 10 Data Analytics Tools You Need To Know In 2025
Pradyumn Singh / 2 Months - 0
- 11 min read
- Data Analytics
- Analytics Tools
- Data Science Tools
- Business Intelligence
Introduction
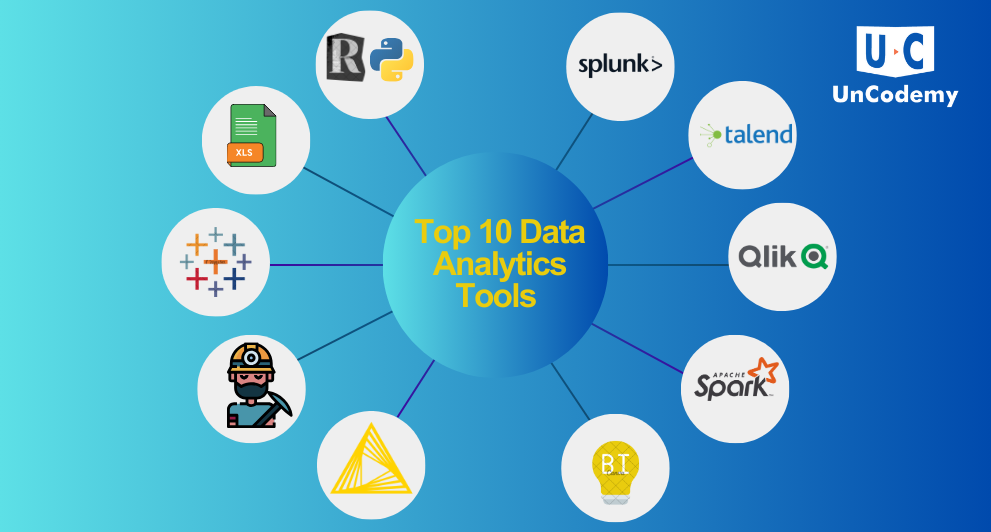
In today’s fast-paced world, the volume of data generated is staggering. With approximately 2.5 quintillion bytes of data being created every day, managing and analyzing this data has become a critical aspect of decision-making in business operations. To cope with this overwhelming volume of data, skilled professionals, particularly Data Analysts, play a crucial role. These professionals rely on a variety of tools to derive insights from data, enabling businesses to make informed decisions. In 2025, learning the right tools is essential for any Data Analyst, whether you’re just starting out or already an expert in the field. This article will delve into the Top 10 Data Analytics Tools you need to know in 2025, including popular and powerful platforms like R, Python, Microsoft Excel, Tableau, RapidMiner, KNIME, Power BI, Apache Spark, QlikView, Talend, and Splunk.
R and Python
Overview
R and Python are among the top programming languages in the Data Analytics field. R is an open-source language, renowned for its statistical and analytical capabilities, while Python is a high-level, interpreted language known for its clean syntax and versatility in various fields beyond data analysis.
Products
- Both R and Python are free to use and downloadable from their official websites.
- Python is appreciated for its simplicity and wide range of libraries.
- R stands out for its strengths in statistical analysis and visualization.
Companies Using
- R: ANZ, Google, Firefox.
- Python: YouTube, Netflix, Facebook.
Recent Advancements/Features
- Python has advanced in machine learning and deep learning with tools like TensorFlow and PyTorch.
- R continues to lead in statistical computing and data visualization with packages like ggplot2 and dplyr.
Pros
- Cross-platform compatibility.
- Extensive libraries and packages for data analysis.
- Python: Easy to learn and read.
- R: Superior for complex statistical analysis.
Cons
- R can be slower and more complex for beginners.
- Python may require more effort for advanced statistical tasks.
Microsoft Excel
Overview
Microsoft Excel is the most widely used tool for data analysis and reporting, offering a wide range of functions for managing, analyzing, and visualizing data.
Products
- Available as part of the Microsoft Office suite.
- Accessible via one-time purchase or Microsoft 365 subscription.
- Compatible with Windows and macOS platforms.
Companies Using
- Used by businesses of all sizes across industries.
- Notable users include Coca-Cola, Ford, and Bank of America.
Recent Advancements/Features
- Power Query and Power Pivot for advanced data manipulation.
- Improved integration with Microsoft tools like Power BI and Teams.
Pros
- Highly user-friendly with intuitive interface.
- Widely used and supported across platforms.
- Includes templates and built-in analytical tools.
Cons
- Limited capabilities for handling very large datasets.
- Not ideal for complex or advanced analytics compared to R or Python.
Tableau
Overview
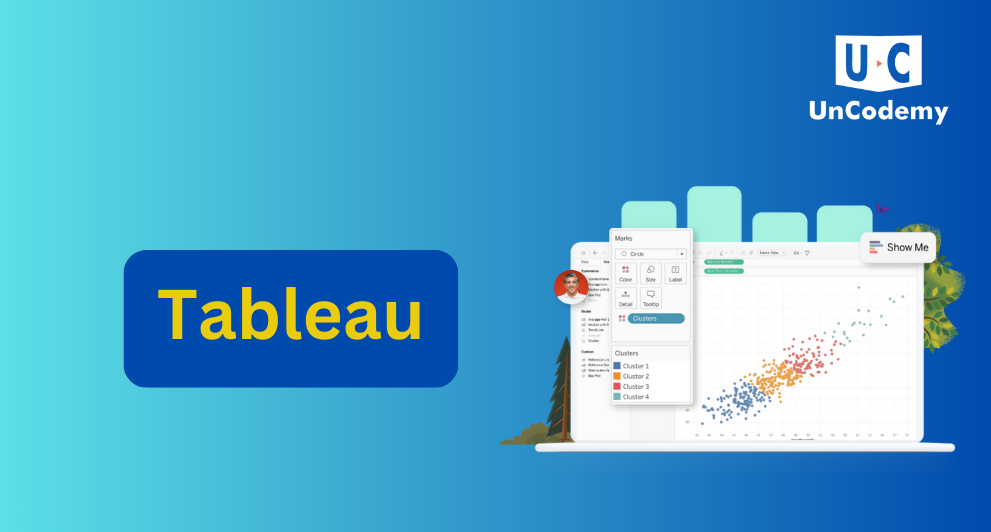
Tableau is a powerful data visualization tool used for converting raw data into interactive dashboards and visualizations.
Products
- Tableau Desktop, Tableau Online, and Tableau Server are available for different organizational needs.
- Tableau Public is a free version for non-commercial use.
Companies Using
- Verizon, Walmart, and the World Health Organization are known users of Tableau.
Recent Advancements/Features
- AI-powered analytics and automated insights.
- Tableau Prep for data cleaning and preparation.
- Enhanced integration with cloud platforms like AWS and Google Cloud.
Pros
- Highly intuitive drag-and-drop interface for visual creation.
- Supports large datasets and real-time data connections.
- Wide variety of chart types and dashboard components.
Cons
- Can be expensive at an enterprise scale.
- Some advanced analytics features are limited compared to R or Python.
RapidMiner
Overview
RapidMiner is a data science platform offering tools for predictive modeling, machine learning, and advanced analytics.
Products
- Free version for small-scale use and paid enterprise editions.
- Supports integration with databases, cloud services, and big data systems.
Companies Using
- Used by Audi, PayPal, and Uber to streamline analytics processes.
Recent Advancements/Features
- Advanced ML algorithms and deep learning integration.
- AutoML features for quick prototyping and deployment.
Pros
- No-code environment makes it accessible to non-programmers.
- User-friendly interface with drag-and-drop functionality.
- Supports full data science lifecycle from data import to model deployment.
Cons
- Performance may lag with very large datasets.
- Advanced users may prefer more customizable, code-based platforms.
KNIME
Overview
KNIME is an open-source platform for data analytics, machine learning, and data mining with a visual workflow interface.
Products
- Offers both a free community edition and paid commercial licenses.
- Integrates well with various data sources and platforms.
Companies Using
- Bayer, Deloitte, and Cisco use KNIME for their data science operations.
Recent Advancements/Features
- Improved deep learning and AI/ML deployment capabilities.
- Enhanced support for big data technologies and cloud environments.
Pros
- Open-source and free to use for most tasks.
- Visual workflow builder is ideal for non-coders.
- Extensive plugin ecosystem adds flexible functionality.
Cons
- Steeper learning curve for beginners compared to drag-and-drop BI tools.
- Resource-intensive for complex workflows on large datasets.
Power BI
Overview
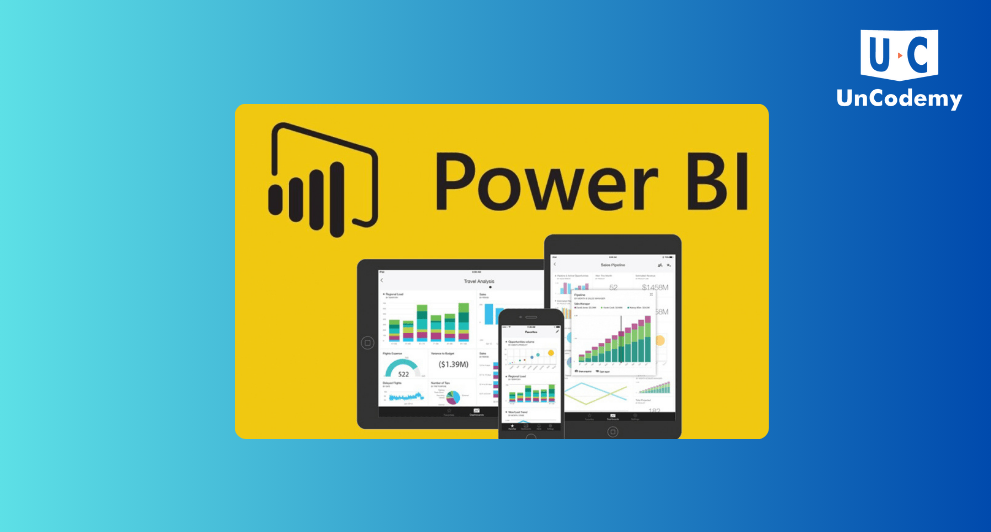
Power BI is Microsoft’s business analytics tool, offering interactive data visualization and business intelligence capabilities for users to create dashboards and reports.
Products
- Offers free, Pro, and Premium versions based on features and collaboration needs.
Companies Using
- Adobe, Rolls-Royce, Heineken.
Recent Advancements/Features
- AI-powered analytics enhancements.
- Improved data visualization capabilities.
- Deeper integration with Excel and Azure.
Pros
- Seamless integration with Microsoft ecosystem.
- User-friendly interface and fast insights.
Cons
- Limited advanced statistical analysis compared to R or Python.
Apache Spark
Overview
Apache Spark is an open-source, distributed computing system used for big data processing and analytics.
Products
- Free and open-source with support for integration across various platforms.
Companies Using
Recent Advancements/Features
- Enhanced support for machine learning and streaming data.
- Expanded compatibility with cloud platforms and big data tools.
Pros
- Highly scalable and fast in-memory data processing.
- Capable of handling massive datasets efficiently.
Cons
- Complex setup and configuration, not ideal for small projects.
QlikView
Overview
QlikView is a business intelligence tool providing powerful data visualization and reporting capabilities, focusing on self-service analytics.
Products
- Available in desktop and enterprise editions with subscription-based pricing.
Companies Using
- Cisco, Nokia, Capital One.
Recent Advancements/Features
- AI-generated insights and self-service dashboard capabilities.
- Improved cloud support and collaboration features.
Pros
- Associative data model allows flexible and intuitive data exploration.
- Interactive dashboards with strong visualization options.
Cons
- Steeper learning curve than some other tools.
- Higher cost for small organizations.
Talend
Overview
Talend is an open-source data integration tool that simplifies connecting, transforming, and managing data across systems.
Products
- Offers both free open-source and premium enterprise versions.
Companies Using
Recent Advancements/Features
- Better support for cloud-native and hybrid data environments.
- Real-time processing and expanded big data capabilities.
Pros
- Unified platform for data integration, quality, and governance.
- Supports cloud and on-premise deployments.
Cons
- User interface can be overwhelming for beginners.
- Enterprise version can be expensive for small teams.
Splunk
Overview
Splunk is a software platform used for searching, monitoring, and analyzing machine-generated big data via a web-style interface.
Products
- Free version available for small-scale use.
- Premium enterprise editions with advanced features for data collection, monitoring, and visualization.
Companies Using
Recent Advancements/Features
- Enhanced machine learning capabilities.
- Real-time analytics improvements.
- Increased focus on cybersecurity and threat detection.
Pros
- Highly scalable for enterprise environments.
- Efficient at processing large-scale machine data.
- Useful for operational intelligence and compliance.
Cons
- Resource-intensive, especially on larger deployments.
- Pricing can be costly for high-volume data use cases.
Conclusion
In 2025, data analytics will continue to be at the heart of informed decision-making across industries. With the immense volume of data being generated daily, mastering the right tools is essential for data analysts to extract valuable insights.
The tools discussed—R, Python, Microsoft Excel, Tableau, RapidMiner, KNIME, Power BI, Apache Spark, QlikView, Talend, and Splunk—offer unique capabilities across the data lifecycle. From reporting and visualization to big data processing and machine learning, these tools empower analysts to meet complex data challenges.
Whether you're starting your journey or advancing your expertise, proficiency in these platforms can significantly boost your opportunities in business intelligence, machine learning, and more.
FAQs
1. Which data analytics tool would you recommend for someone who wants to balance simplicity with powerful capabilities in 2025?
Answer: Python is ideal due to its clean syntax, strong machine learning libraries, and flexibility, making it suitable for analysts at any level.
2. If you had to choose between Power BI and Tableau, which one would you pick for high-level analytics and why?
Answer: Tableau is preferred for advanced analytics due to its superior visualization features and performance with complex datasets.
3. What makes Apache Spark more efficient than traditional data processing tools when dealing with vast datasets?
Answer: Apache Spark uses in-memory processing and supports real-time data streaming, offering faster operations and better scalability than traditional tools.
4. How does KNIME stack up against other data analytics platforms when it comes to building data workflows?
Answer: KNIME excels with its drag-and-drop workflow builder, making complex data processes accessible without coding while maintaining integration capabilities.
5. Why might an analyst prefer Splunk over other tools for machine-generated data analysis?
Answer: Splunk is designed specifically for analyzing machine-generated data, offering real-time insights, monitoring, and security features unmatched by general-purpose tools.
6. Can RapidMiner really replace traditional coding in machine learning workflows?
Answer: RapidMiner simplifies ML with no-code/low-code tools but may not replace Python or R entirely for advanced custom modeling needs.


