Types of Graph in Data Structure with Visual Representation
In the world of computer science, especially in the study of data structures, graphs hold a significant place due to their ability to represent complex relationships and networks. Whether it's mapping social connections, analyzing transportation routes, or simulating communication networks, graphs serve as one of the most versatile and powerful data structures. A solid understanding of the types of graph in data structure is therefore essential for anyone enrolling in a Data Structures Course in Noida, or aiming to master advanced problem-solving and algorithmic thinking.
Types of Graph in Data Structure with Visual Representation
Mr. Bambam Yadav / 1 days
0
4 min read
This article explains what graphs are, breaks down the various types with simple and practical visual representations, and explains how each graph type functions in real-world scenarios. The aim is to provide a comprehensive learning experience for students and enthusiasts who wish to explore graphs with clarity and depth.
Introduction to Graph in Data Structure
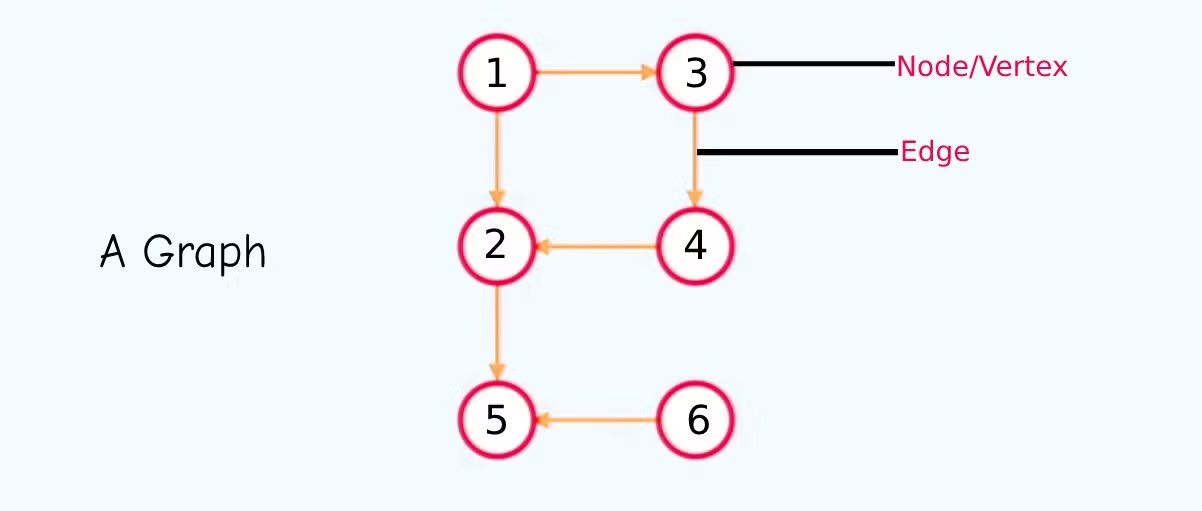
A graph is a collection of nodes, often called vertices, connected by edges. Each edge represents a relationship or connection between two vertices. Graphs are used to model both physical and abstract systems—anything from cities connected by roads to users connected through social media platforms.
There are two main elements in any graph:
Vertices (V):These are the individual points or nodes in the graph.
Edges (E):These are the lines that connect the vertices and define their relationships.
A graph can be represented in various ways including adjacency matrix, adjacency list, or edge list depending on the use case and performance requirements.
Why Graphs Matter in Computer Science
Graphs are not just academic concepts—they are tools used across industries. GPS systems use graphs to find the shortest path between locations. Internet routers use graph algorithms to determine the fastest way to transmit data. Social networks use graphs to suggest friends and analyze user behavior. Even search engines use graph-based models like PageRank.
Because of this real-world applicability, students taking a 14. Data Structures Course in Noida are expected to deeply understand graph theory. Mastering the types of graph in data structure enables students to solve a wide range of problems efficiently.
Types of Graph in Data Structure
Graphs come in many types, each suited to specific problems. While the structure of all graphs remains centered around vertices and edges, their properties—such as whether the edges have direction or weight—create different classifications. Understanding each type with visual clarity makes the concept easy to grasp.
Let’s explore each of these types in detail.
1. Directed and Undirected Graph
The first classification of graphs is based on the direction of edges.
Undirected Graph
In an undirected graph, the edges have no direction. This means the relationship between two vertices is mutual. If there is an edge between vertex A and B, one can move from A to B or from B to A. For example, in a graph representing friendships, if A is friends with B, B is also friends with A.
Visual Representation:
                            A — B
                            | |
                            C — D
Here, A is connected to B and C, and those connections are bidirectional.
Directed Graph (Digraph)
In a directed graph, the edges have a specific direction, represented by arrows. If there is an arrow from vertex A to vertex B, one can travel from A to B, but not necessarily from B to A. Directed graphs are useful in cases like representing followers on social media (A can follow B without B following back).
Visual Representation:
                            A → B
                            ↑ ↓
                            C ← D
Each arrow indicates the allowed direction of traversal.
2. Weighted and Unweighted Graph
Another common classification is based on whether the edges have weightsor costs associated with them.
Unweighted Graph
In an unweighted graph, all edges are considered equal. They simply indicate a connection, without any cost or distance associated.
Weighted Graph
In a weighted graph, each edge carries a numerical value known as the weight, representing things like cost, time, or distance. This is especially useful in problems involving shortest paths (like Google Maps) or cost minimization.
Visual Representation:
                            A —(4)— B
                            |   |
                            (2) (3)
                            |    |
                            C —(1)— D
Here, each number on the edge represents the weight of that connection.
3. Cyclic and Acyclic Graph
Graph types can also be classified based on the presence of cycles—a path that starts and ends at the same vertex.
Cyclic Graph
A cyclic graph contains at least one cycle. These are common in scenarios where mutual relationships or loops are present.
Example: In a network of roads connecting cities, it is common to have multiple routes that loop back to the same starting point.
Acyclic Graph
An acyclic graph has no cycles. It is often used in scheduling problems or task ordering where loops must be avoided.
4. Connected and Disconnected Graph
This classification depends on whether there is a path between every pair of vertices.
Connected Graph
In a connected graph, there is at least one path between every pair of vertices. This is a common structure in real-world applications like network design and transportation systems.
Disconnected Graph
A disconnected graph has at least one vertexthat cannot be reached from another vertex. This means the graph has multiple isolated components.
Visual Example:
Component 1: A — B — C
Component 2: D — E
There’s no way to go from Component 1 to Component 2.
5. Tree and Forest
A special kind of graph is a tree, which is an acyclic connected graph. Trees are foundational in data structures and are often used in hierarchical data models, like file systems or organizational charts.
Tree
A tree has n vertices and (n - 1) edges, and it is both connected and acyclic. There is exactly one path between any two vertices.
Example Structure:
                             A
                            / \
                            B   C
                           / \
                           D  E
Here, A is the root, and there is only one path to every other node.
Forest
A forest is a collection of disjoint trees. This occurs when a graph has multiple tree-like components.
6. Complete Graph
A complete graph is one where every vertex is connected to every other vertexby a direct edge. These graphs have the maximum number of edges possible.
For n vertices, a complete graph has n(n-1)/2 edges in an undirected version, and n(n-1) edges in a directed version.
Example (Undirected Complete Graph with 4 vertices):
                            A — B
                            |\  |
                            C — D
Each node is directly connected to all others.
7. Bipartite Graph
A bipartite graph is a special graph where the vertex set can be divided into two sets such that no two vertices within the same set are adjacent. All edges connect a vertex from one set to a vertex from the other.
These are useful in matching problems such as job assignments, where employees (Set A) can be connected to tasks (Set B).
Visual Structure:
                            Set A:  A   B
                                 \ /
                            Set B:  X   Y
Connections exist only between Set A and Set B.
8. Sparse and Dense Graph
This classification is based on the number of edgesrelative to the number of vertices.
Sparse Graph
A graph is sparse if it has relatively few edges. Most real-world networks, like social graphs, are sparse because not every person is connected to every other person.
Dense Graph
A dense graph has a high number of edges, close to the maximum possible. Complete graphs are extreme examples of dense graphs.
9. Subgraph
A subgraph is a portionof a graph that contains a subset of vertices and edges from the original graph. Subgraphs are useful for analyzing smaller parts of a larger network or applying algorithms locally before scaling up.
Graph Representation Methods
Graphs can be stored in memory using different methods, depending on the graph’s size and usage.
Adjacency Matrix
A 2D matrix where the element at row i and column j is 1 (or weight) if there is an edge from vertex i to j, otherwise 0. Best for dense graphs.
Adjacency List
Each vertex maintains a list of all its adjacent vertices. Best for sparse graphs, as it uses less space.
Use Cases and Applications
Graphs are used in a wide range of industries and applications:
Social Networks:Modeling users and their connections
Web Crawling:Representing web pages and links
Route Optimization:Shortest path problems in maps
Computer Networks:Routing and bandwidth optimization
Recommendation Engines:Suggesting connections or content
Dependency Resolution: In software package management and task scheduling
These applications demonstrate why learners in a 14. Data Structures Course in Noidamust pay special attention to mastering graph types. Understanding graphs allows developers and engineers to design better systems, write efficient code, and solve high-impact problems.
Conclusion
Graphs are powerful, flexible tools that form the backbone of many modern computing applications. The different types of graph in data structure—directed, undirected, weighted, cyclic, bipartite, and more—offer unique ways to model data and relationships. Each type serves specific problem scenarios and has distinct visual and structural properties.
Students pursuing a 14. Data Structures Course in Noida are encouraged to develop a strong grasp of these graph types not just for academic purposes, but also to prepare for real-world challenges. With clear understanding and visual imagination, graph theory becomes not only manageable but also fascinating.
From modeling user networks to enabling artificial intelligence algorithms, the reach of graphs is vast and continually expanding. The better one understands their structure and behavior, the more capable they become in designing efficient, innovative solutions.