The spirit behind EDA is inquisitiveness. Imagine that you are provided with a dataset of customer purchases in an online retail business. The need to explore comes before making any suggestions about what customers like or assigning equations to predict what customers will do in the future. What is the number of customers? What are its age distributions? Do the purchase records have missing values? Are there some products that are being sold more during specific months? This preliminary exploration is not a matter of confirming or rejecting hypotheses but of settling into the data and learning what it will give. An analysis of detailed descriptions and example graphics shows how DANA provides numerical summaries and graphical displays that help researchers understand the structure, shape, and peculiarities of the data. The exploration establishes the course toward more detailed analysis, modelling, or business decision-making.
The main EDA principle is that the data must not be constrained into pre-moulded shapes too soon. Traditional statistical methods begin with the assumptions and then determine whether these assumptions hold up in the data. Where DA inverts this by permitting the data itself to identify potential avenues of inquiry. An example is that, rather than assuming that spending increases with income, an analyst doing EDA will plot the two variables and see if there are any patterns, before deciding whether or not there is a strong relationship between the two measures. This freedom to explore makes EDA literate in addition to analytical. Analysts are also expected to explore their data more playfully, to see it in various ways and even to interrogate anomalies rather than dismiss them.
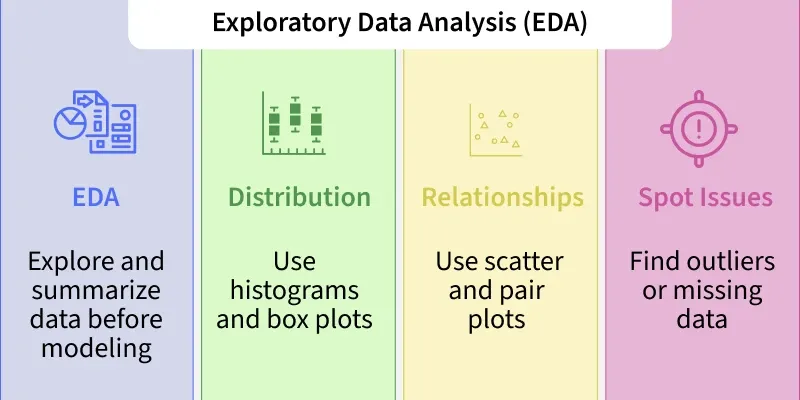
One of the greatest tools in EDA is visualization. People are visual by nature, and it is always difficult to interpret complex data without the help of charts, graphs, and plots. A histogram, e.g., may show that a distribution like the customer age is skewed towards either the younger or older populations, or that it falls in a normal distribution. A scatter plot can immediately illustrate whether two variables will travel in the same direction or separately. Boxplots indicate outliers likely to skew the averages. EDA puts numbers and tables in perspective to help analysts understand the larger picture at a glance. Some of the most common and easily used tools are Power BI, Tableau, Python packages, such as Matplotlib or Seaborn, and even Excel which can be used to conduct this visualization process and make this process interactive and intuitive.
However, EDA is not just about producing aesthetic displays; it is also about cautious numerical summaries. Descriptive statistics (such as mean, median, mode, standard deviation, and quartiles) provide valuable information about the dispersion and central tendencies of the data. Correlation coefficients help quantify how strong relationships are between variables. Frequency tables indicate the frequency of occurrence of certain values. These summaries serve as guidelines that direct the analyst to see areas that require comparative examination. As a case in point, when the mean customer income is notably higher than the median, it could indicate that there may be some extremely wealthy customers who raise the average, which in its turn could indicate that there is an unequal distribution of income. This observation can be used later to influence the targeting of marketing campaigns.
The other key application of EDA is in identifying the problem with the data quality. Data in the real world is not clean. It frequently arrives with missing values, duplicate entries or inconsistent formatting, or in outright error. These problems can silently corrupt the precision of the whole project without adequate exploration. To develop an illustration, consider an example of healthcare data in which 20 per cent of the patients have no blood pressure readings. Without an analysis of this gap, building a model based on such data may result in highly unreliable recommendations. On the same note, when a dataset contains two or more copies of a transaction record, sales values will be overstated, which will have business implications. The work of EDA serves as a filter that can highlight these deficiencies to enable them to be corrected prior to further analysis.
Another aspect that can be extremely useful with the help of EDA is outliers, or data points which strongly deviate from the rest. Exceptions are not necessarily errors, but may be significant deviations possible to be considered. As an example, an unexpected jump in orders coming in a particular region may be a sector or a data entry mistake or a sales breakthrough product being marketed. DA assists analysts in making the difference between noise and signals as it distinguishes these out-of-the-ordinary points and then seeks explanations of the causes. In the absence of this process, outliers can distort averages, inflate variances or produce misleading patterns in models. By closely looking into them, analysts can either leave them out of the study, rectify them or further analyse them as possible prospects.
Use of dedicated data analysts (DA) is the groundwork of feature engineering in machine learning ventures. Feature engineering is the combination of existing variables to introduce new variables in order to enhance model performance. Even before developing the new features, one should know perfectly well about the original variables, their distributions, their relations, and the limits they possess. As an example, if e-commerce transactions were collected, EDA may indicate that the date of purchase is a big influence on spending behaviours. This observation can be used to introduce such features as the day of the week, month, or an indicator of a holiday season, which can immensely boost predictive models. In the absence of EDA, these possibilities of enhancing the data are unseen.
The beauty, as well as the challenge of EDA, is that it does not have a rigid formula. There is no standard checklist that can ensure that. Rather, it is a developing process that relies more on the creativity and critical thinking of the analyst. You can start with just descriptive statistics, then perform scatter plots, spot a good correlation, investigate subsamples, realise that not all values are recorded, clean that mess, and then re-run the distributions. At every step of the journey, new puzzles are found and the analyst sharpens their picture. This back-and-forth investigation is repeated until the data seems familiar and a direction for further investigation or modelling is apparent.
DA does not apply only to academic or technical projects; it is of great practical use in commercial decision-making. Another example is that a retail company may employ EDA to learn about the reasons why certain products are more likely to sell in certain areas. A healthcare provider can use EDA to determine which groups of patients are likely to be affected by a condition the most. A financial institution can run EDA on transaction data to identify aberrant spending dynamics that may signify fraud. In all these instances, EDA offers intelligent explanations that lead to strategy, productivity, and innovation. Decisions would be made on assumptions instead of evidence without EDA.
EDA can be neglected because it is less exciting than creating a predictive model or implementing artificial intelligence. The burden is that EDA most likely can save more time and resources compared to any of the other steps of the data pipeline. This discovery of problems in its early days averts expensive mistakes in subsequent stages. By indicating patterns, it refines the object of analysis. Cleaning the data and knowing the nuances is a precondition for good and reliable models. In a few words, the EDA is not a process that should be hurriedly completed but enjoyed.
To imagine EDA without difficulty, one can use an analogy with preparing for a journey. A prudent traveller would make sure they checked the map, the possible routes, the weather conditions, and the condition of the car before going on a road trip. Missing these steps would bring them to the destination, but the process will be more perilous, with higher risks of delays or other malfunctions. In the same way, EDA makes the analyst ready to go on the journey through data checking, structure exploration, and possible roadblocks identification. This preparation makes the road ahead easier, more solid, and in many cases, more pleasant.
In summary, EDA serves as the bridge between unprocessed data and meaningful insights. It is about embracing discovery with curiosity, applying precision with accuracy, and questioning patterns with logical reasoning. Through this process, analysts can uncover errors, detect anomalies, reveal trends, and build compelling narratives that support informed decision-making.For individuals who wish to master these practical analytical skills in a structured and industry-oriented manner, enrolling in a Data Analytics course in Noida can provide hands-on exposure to real datasets, visualization tools, and statistical techniques. Such professional training strengthens the ability to perform effective exploratory analysis and convert raw information into actionable business intelligence.