From Classroom to Data Analyst
Mohd Shahid transformed his career trajectory in just 6 months. By mastering data analytics, Python, SQL, and business intelligence tools, he secured a 3.30 LPA package and a pivotal role as Data Analyst at Marsh — a global leader in insurance broking and risk management.
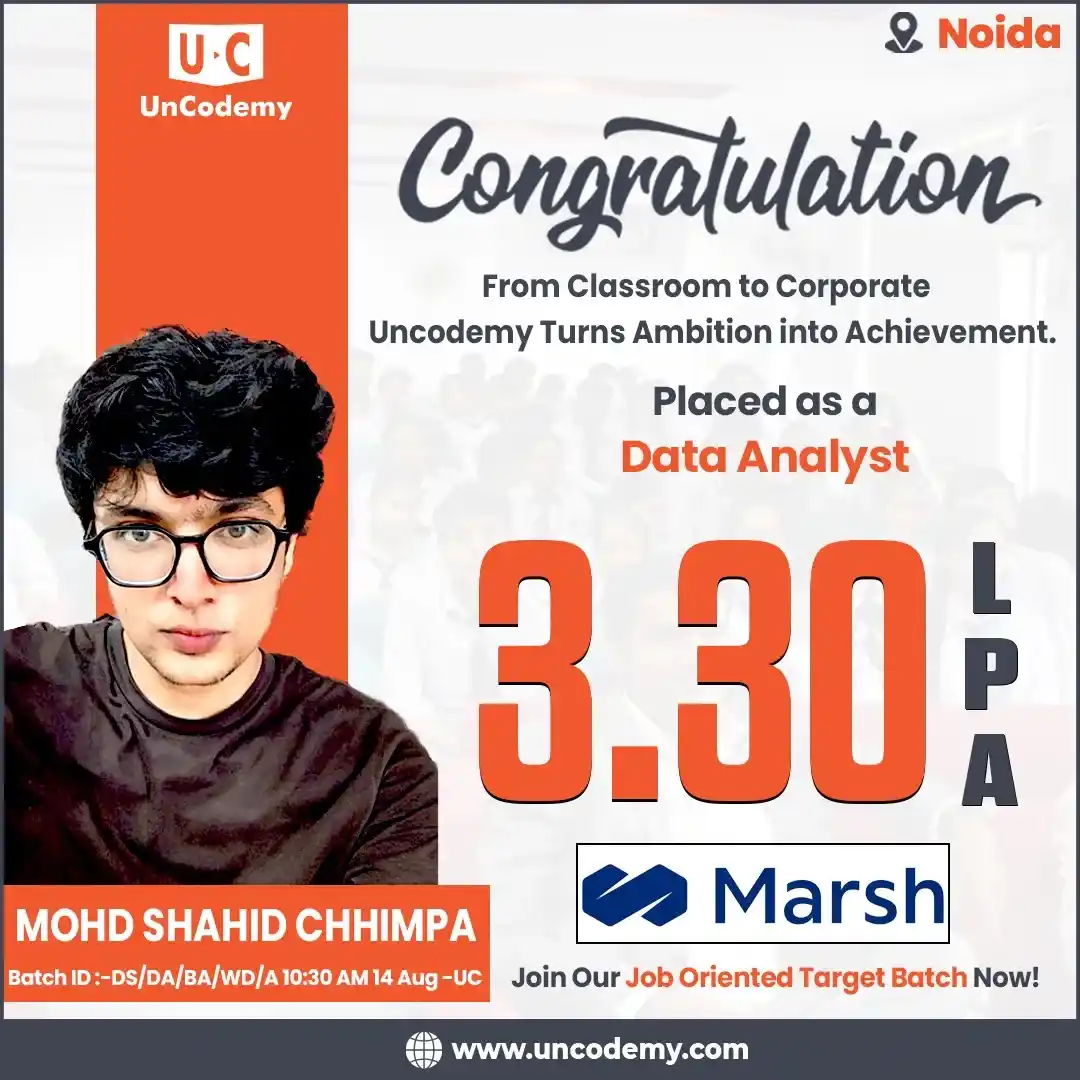
Mohd Shahid Chhimpa
Data Analyst
3.30 LPA
Salary Package
35
Days to Hire
Marsh
Global Leader
Top 8%
Cohort Ranking
The Pivot
Before the Program
- Basic understanding of statistics and data concepts.
- Struggled with Python, SQL, and data visualization.
- Imposter syndrome during technical interviews.
- No portfolio of data analytics projects.
After the Program
- Mastery in Python, Pandas, NumPy, and SQL.
- Confident in data wrangling, EDA, and visualization.
- Aced technical rounds with multiple offers.
- Built an end-to-end data analytics solution with real-world impact.
The Learning Journey Timeline
Phase 1: The Foundation
Mastering Python programming, statistics, and SQL. Building a strong foundation in data manipulation and analysis.
Phase 2: The Analytics Phase
Diving into data visualization, business intelligence, and advanced analytics. Developing end-to-end data solutions with real-world datasets.
Phase 3: The Placement Prep
Intensive mock interviews, case study presentations, and resume optimization. Refining the personal narrative for data analyst roles.
Core Tech Stack Mastered
Capstone Project Mastery
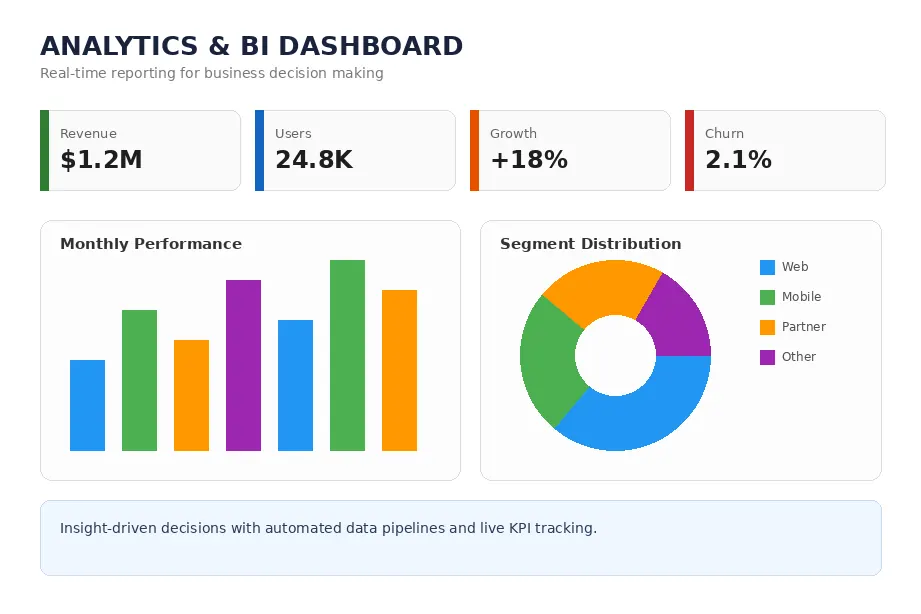
Sales Analytics Dashboard
DATA ANALYTICSAn end-to-end sales analytics solution for a retail client, featuring data cleaning, exploratory analysis, predictive modeling, and interactive dashboards.
Handling large-scale sales data with missing values and inconsistencies, while delivering actionable insights for business decision-making.
Implemented data preprocessing pipelines with Pandas and NumPy, built visualizations with Tableau, and created predictive models for sales forecasting. Delivered a comprehensive dashboard for real-time monitoring.
Performance Scorecard
Overcoming Challenges
Mastering data analytics and handling complex datasets was initially a significant hurdle. Shahid spent over 40 additional hours in peer-learning sessions to understand data wrangling and visualization techniques. Balancing full-time study with part-time work required immense time-management discipline, teaching him prioritization skills that proved invaluable during his technical interviews.
Interview Preparation Intensive
Mock Interviews
Completed 15+ rigorous technical mocks with industry experts, refining approach to data analytics and problem-solving.
Resume Workshops
Iterated on portfolio presentation to highlight impact-driven metrics and data analytics project outcomes.
Soft Skills Training
Mastered the STAR method for behavioral rounds, ensuring clear, confident communication of past experiences.
Interview & Placement Process
Online Assessment
Aced a 90-minute test covering Python, SQL, and statistics concepts.
Technical Round
Live coding interview tackling data manipulation, visualization, and analytical problem-solving.
Case Study
Presented a complete data analytics solution for a business problem, demonstrating analytical thinking and communication skills.
Managerial
Final discussion focusing on behavioral questions, culture fit, and career aspirations.
The Offer
Marsh
Data Analyst
Joining the analytics team responsible for delivering data-driven insights and business intelligence solutions to enterprise clients.
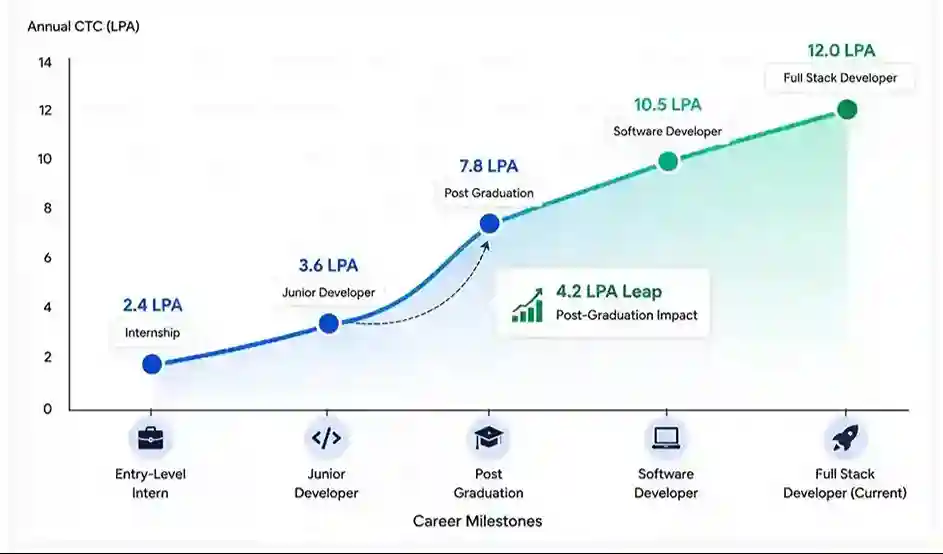
Trajectory: The Ascent
Shahid's compensation growth mapping from his entry-level role to his current Data Analyst position, highlighting the 3.30 LPA leap post-graduation.
From Internship to Data Analyst
- 0.8 LPA — Entry-Level Internship
- 1.1 LPA — Junior Analyst
- 2.2 LPA — Post-Graduation
- 2.9 LPA — Associate Data Analyst
- 3.30 LPA — Data Analyst
Data Analytics Trainers & Mentors



"Shahid's ability to turn raw data into actionable insights is what made him stand out. He approached every dataset with curiosity and rigor, always looking for the story behind the numbers. His dedication to mastering the full data analytics lifecycle and his problem-solving mindset made him a perfect fit for the Marsh team."
- Mr. Upendra Kumar Tiwari
"Consistency was my secret weapon. The curriculum was tough, but showing up every single day and trusting the process changed my life. Uncodemy turns ambition into achievement."
- Mohd Shahid Chhimpa
Ready to Write Your Own Success Story?
Join our job-oriented target batch and take the first step towards your career transformation.