
#1 India's Top IT Training Institute

×

About Uncodemy

Know more about who we are and what we stand for.

About Us

About Us

Discover our mission to equip individuals with essential IT skills and industry expertise.

Read More →
UnCodeMy Gallery

UnCodeMy Gallery

Explore highlights from our IT training sessions and success stories.

Read More →
×

Free Resources

Learn, practice and plan your career — bilkul free.

Tutorials

Tutorials

Step-by-step written tutorials to learn any technology at your own pace.

Read More →
Free Counselling

Free Counselling

Book a free video counselling session and pick the right course for you.

Read More →
Online Compiler

Online Compiler

Write, run and test your code online — no setup required.

Read More →

Data Analytics Course in Bareilly with Gen AI & Placement Assistance

Bareilly has always been a trading town — zari embroidery, cane furniture, surma, grain and sugar have moved through its markets for generations. Today those same businesses keep their accounts in software, and they need someone who can read the numbers properly. Uncodemy's Data Analytics Course trains Bareilly learners to be that person. Across 6–7 months of live online classes, a trainer takes you from Excel and SQL to Python, Statistics, Power BI, Tableau and Generative AI, one practical step at a time.

You won't find an Uncodemy classroom in Rohilkhand: in-person teaching happens only in Delhi and Noida, and the Delhi branch sits in Shakarpur Extension right beside DSEU Ambedkar College, minutes on foot from the Nirman Vihar and Laxmi Nagar Metro Stations. From Bareilly you plug into those same batches over live video and get 120+ hours of learning, 75+ trainer-led classes, hands-on projects and your own placement mentor. The fee is ₹17,500; add 18% GST and you pay ₹20,650.

Why Choose Uncodemy?

14+Years of Training Excellence
850+Companies in Our Hiring Network
54,000+Learners Trained
200+Corporate Associations
₹17,500 + 18% GST₹20,650
  • Program Fee₹17,500 + 18% GST
  • Total Fee (incl. 18% GST)₹20,650
  • EMIFrom ₹4,032/month
  • Mode in BareillyLive Online (classroom only at Delhi & Noida centres)

Program Details

Data Analytics with Gen AI — Instructor-Led Training & Career Support Program

Bareilly learners spend six to seven months on live online classes covering Excel, SQL, Python, statistics, Power BI, Tableau and Gen AI, practising on trading, sugar-mill and retail examples, with a mentor reviewing progress and an interview sprint to close.

  • Learning120+ Hours
  • Program Duration6–7 Months
  • Live Training75+ Live Sessions
  • Technology Coverage10+ Tools & Technologies
  • Practical LearningHands-on Projects & Case Studies
  • Program Fee₹17,500 + 18% GST
  • Total Fee₹20,650
  • EMIStarting From ₹4,032/Month*
  • Career SupportDedicated Career & Placement Assistance
  • Hiring Network850+ Companies

Data Analytics Course in Bareilly — Quick Facts

Course
Data Analytics with Gen AI
Provider
Uncodemy Edutech Pvt. Ltd.
Total Learning
120+ Hours
Curriculum
9 Modules
Projects
5 Guided + 1 Capstone
Tools
Excel, SQL, Python, Statistics, Power BI, Tableau and Gen AI
Modes
Live Online (classroom only at Delhi & Noida centres)
Prior Coding
Not Required
Certificate
Uncodemy Program Certificate

List of Placed Students Trained by Uncodemy

When you finish, you'll be able to open a messy sales register or stock file and hand back a tidy, analysed and well-argued answer using whichever tool suits it best. After the job-readiness phase, eligible learners start applying for analyst posts — here are a few results from our records.

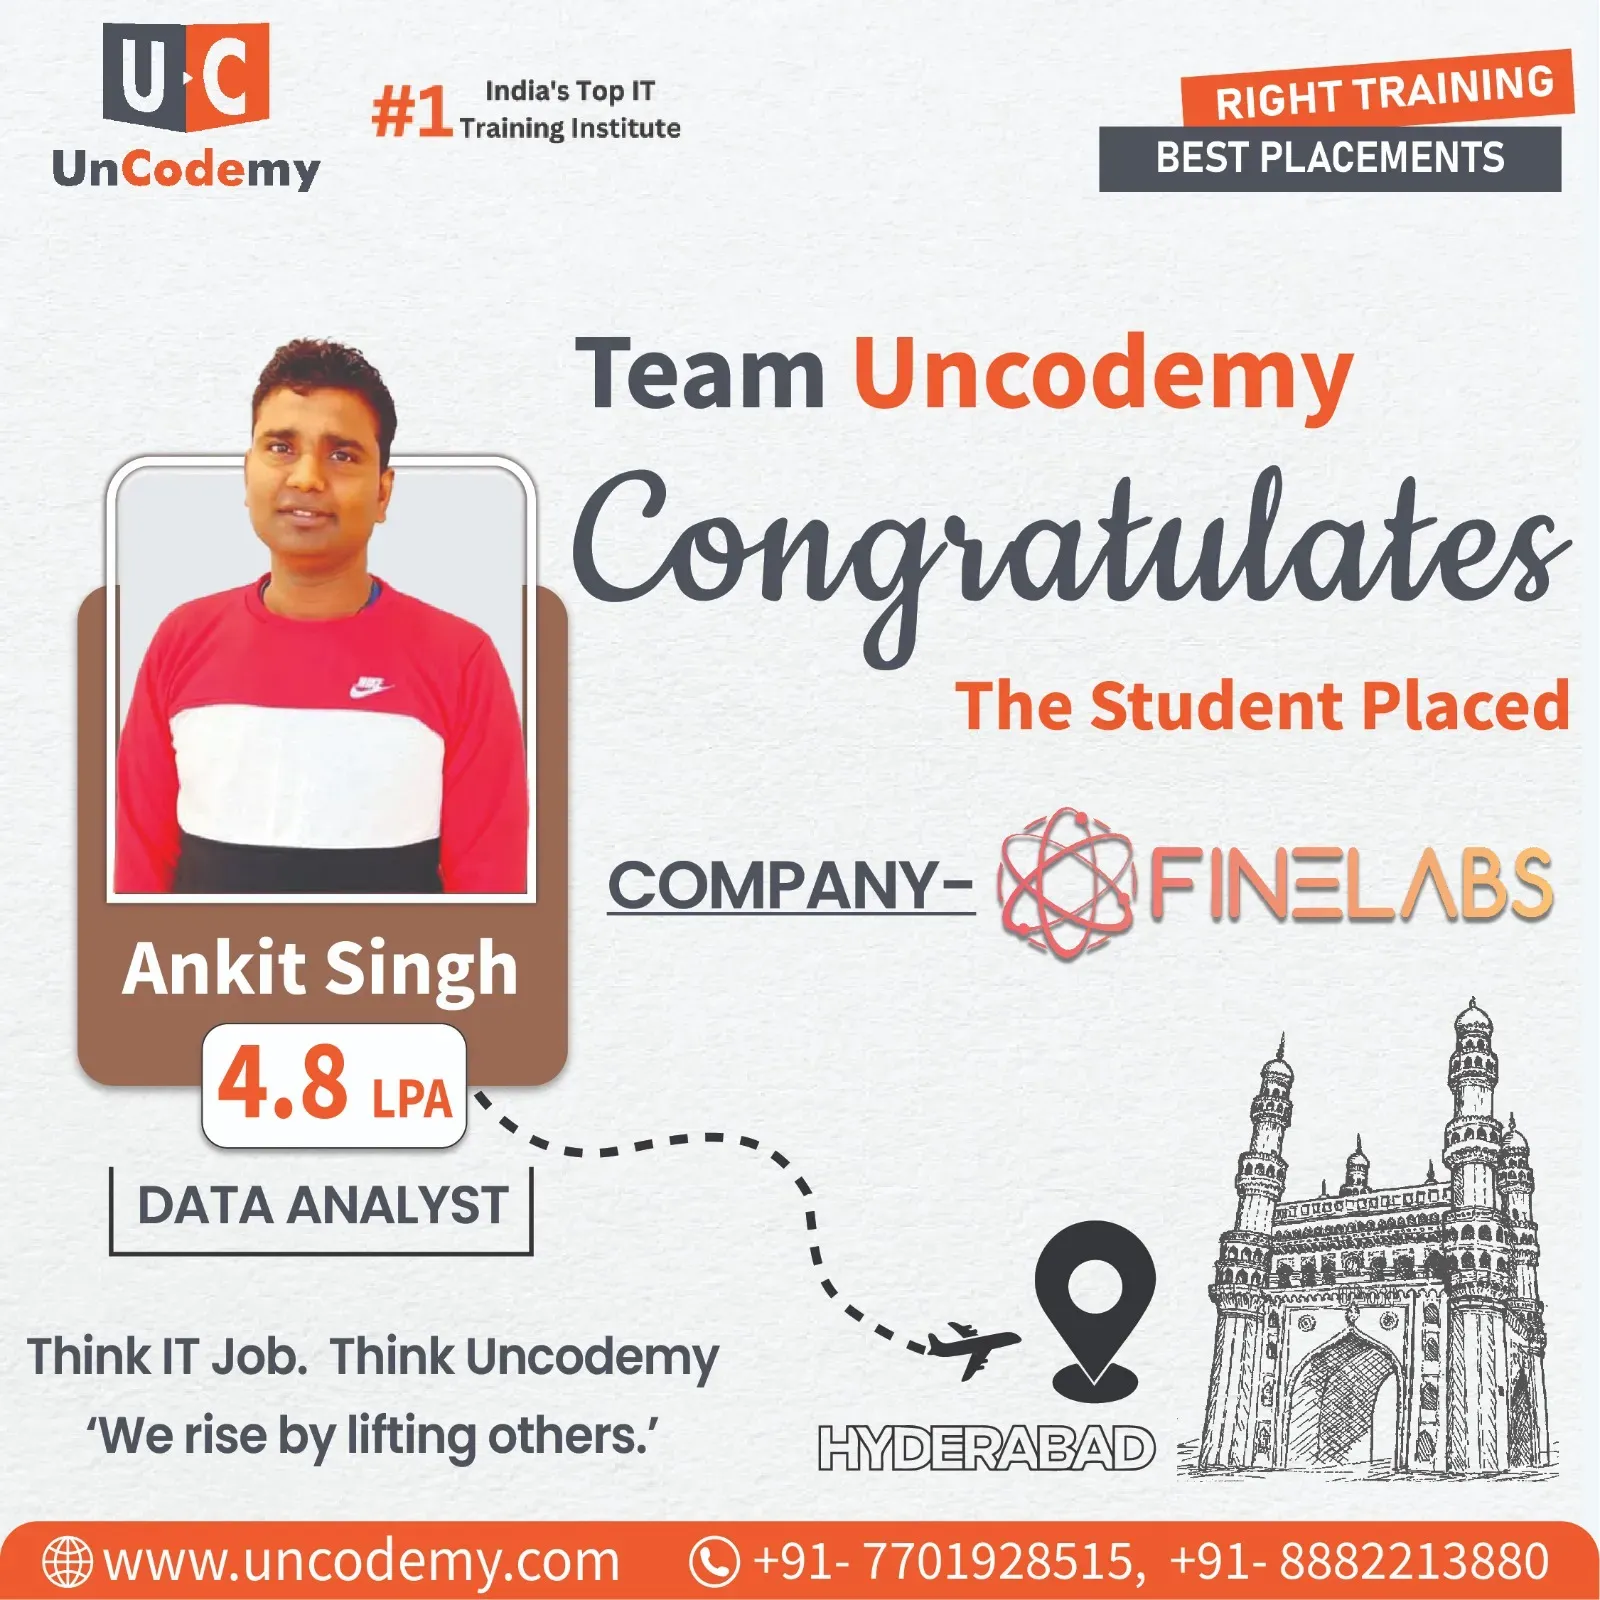
Ankit Singh, Data Analyst placed at FINELABS4.8 LPAHyderabad

Ankit Singh

Data Analyst

Placed at
FINELABS
Program
Data Analytics Batch
Batch
DA/09/0823/S WD 7PM
Read placement record
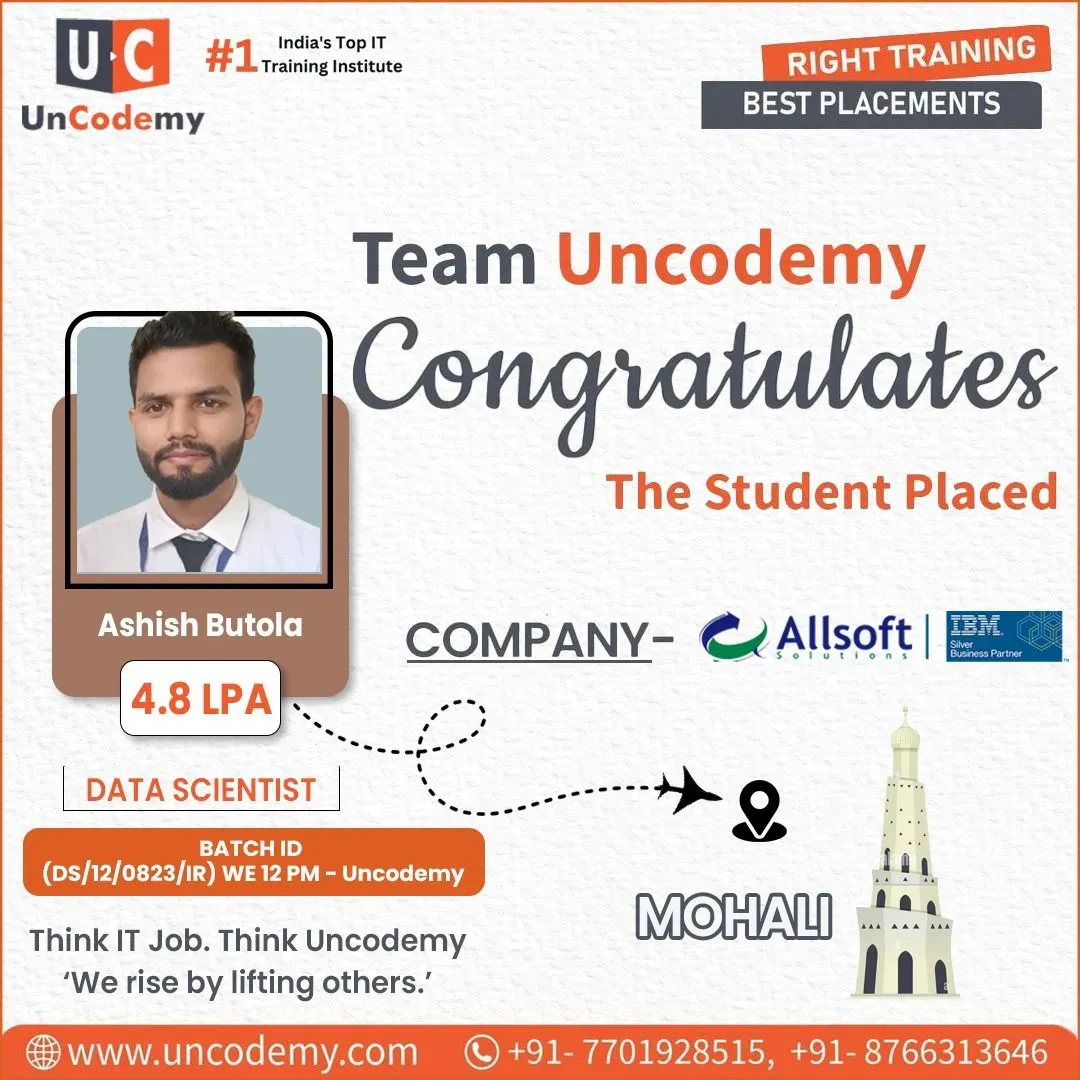
Ashish Butola, Data Analyst placed at Allsoft Solutions4.8 LPAIndia

Ashish Butola

Data Analyst

Placed at
Allsoft Solutions
Program
Data Analytics Batch
Batch
DS/12/0823/IR WE 12 PM
Read placement record
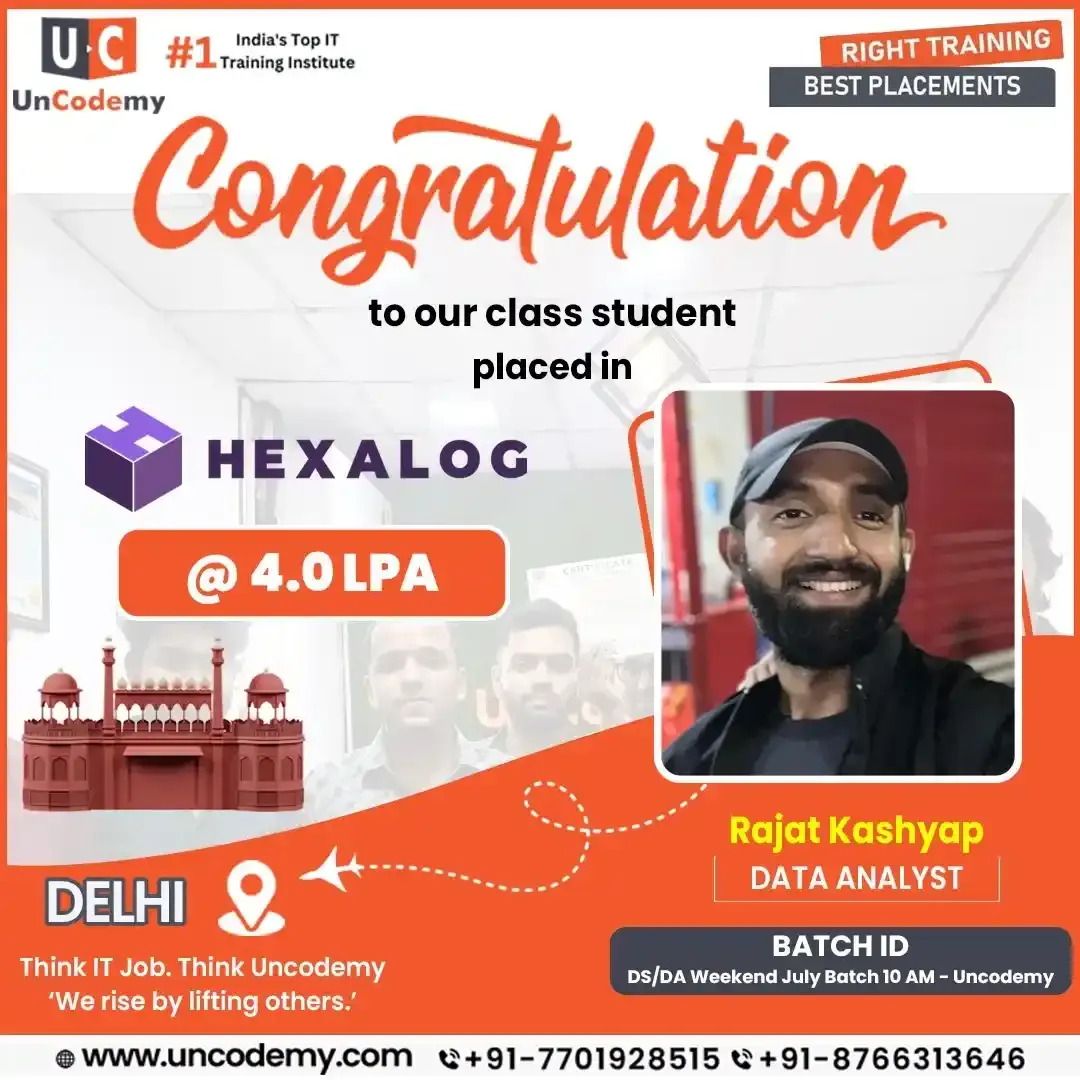
Rajat Kashyap, Data Analyst placed at Hexalog4.0 LPADelhi

Rajat Kashyap

Data Analyst

Placed at
Hexalog
Program
Data Analytics Batch
Batch
DS/DA Weekend July Batch 10 AM
Read placement record
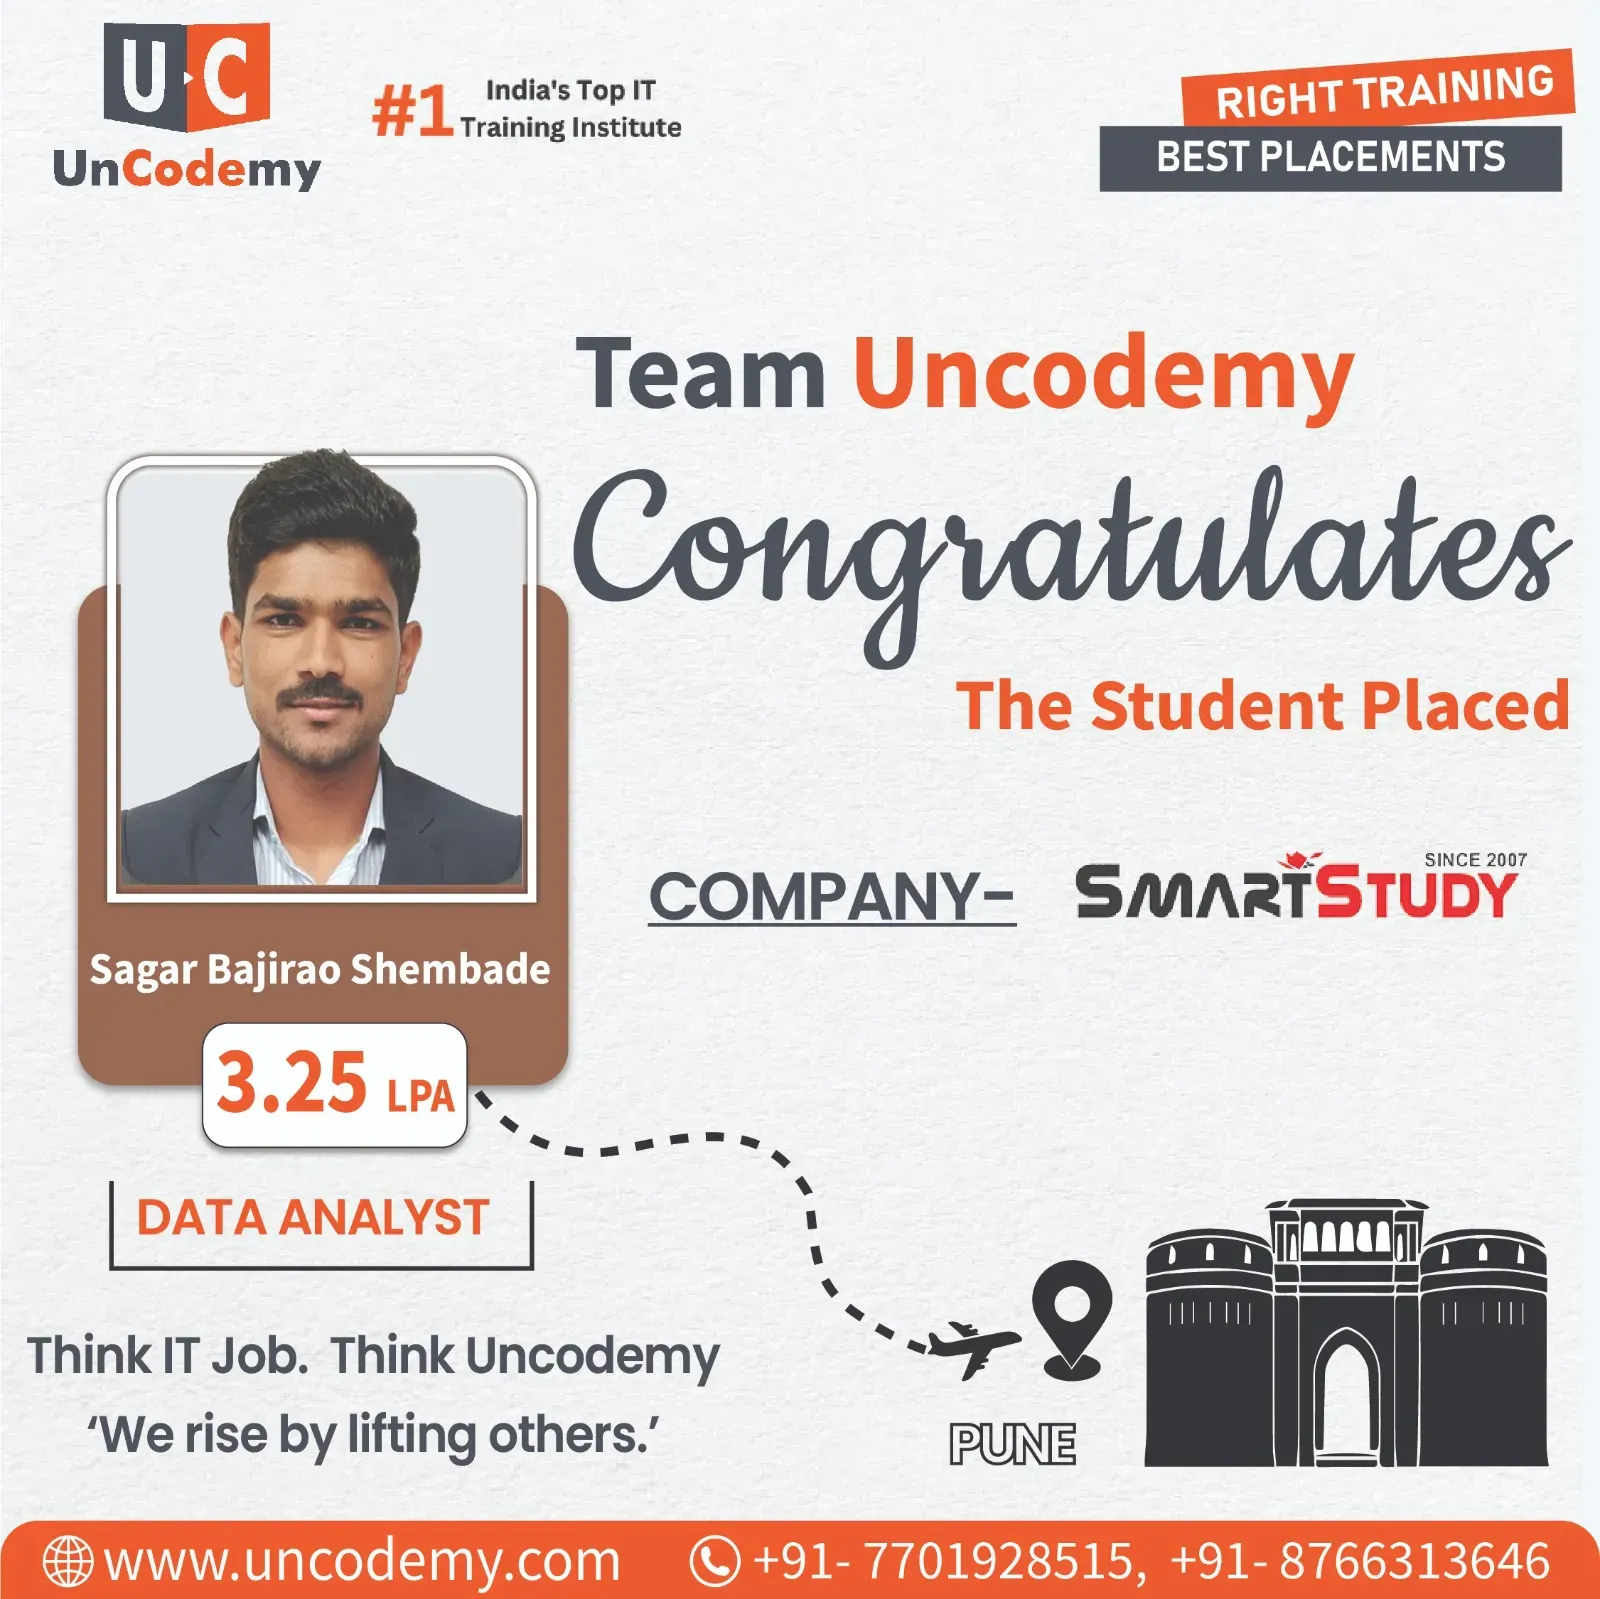
Sagar B. Shembade, Data Analyst placed at SmartStudy3.25 LPAPune

Sagar B. Shembade

Data Analyst

Placed at
SmartStudy
Program
Data Analytics Batch
Batch
DA/WD/S 08:00 PM 08 JAN-UC
Read placement record
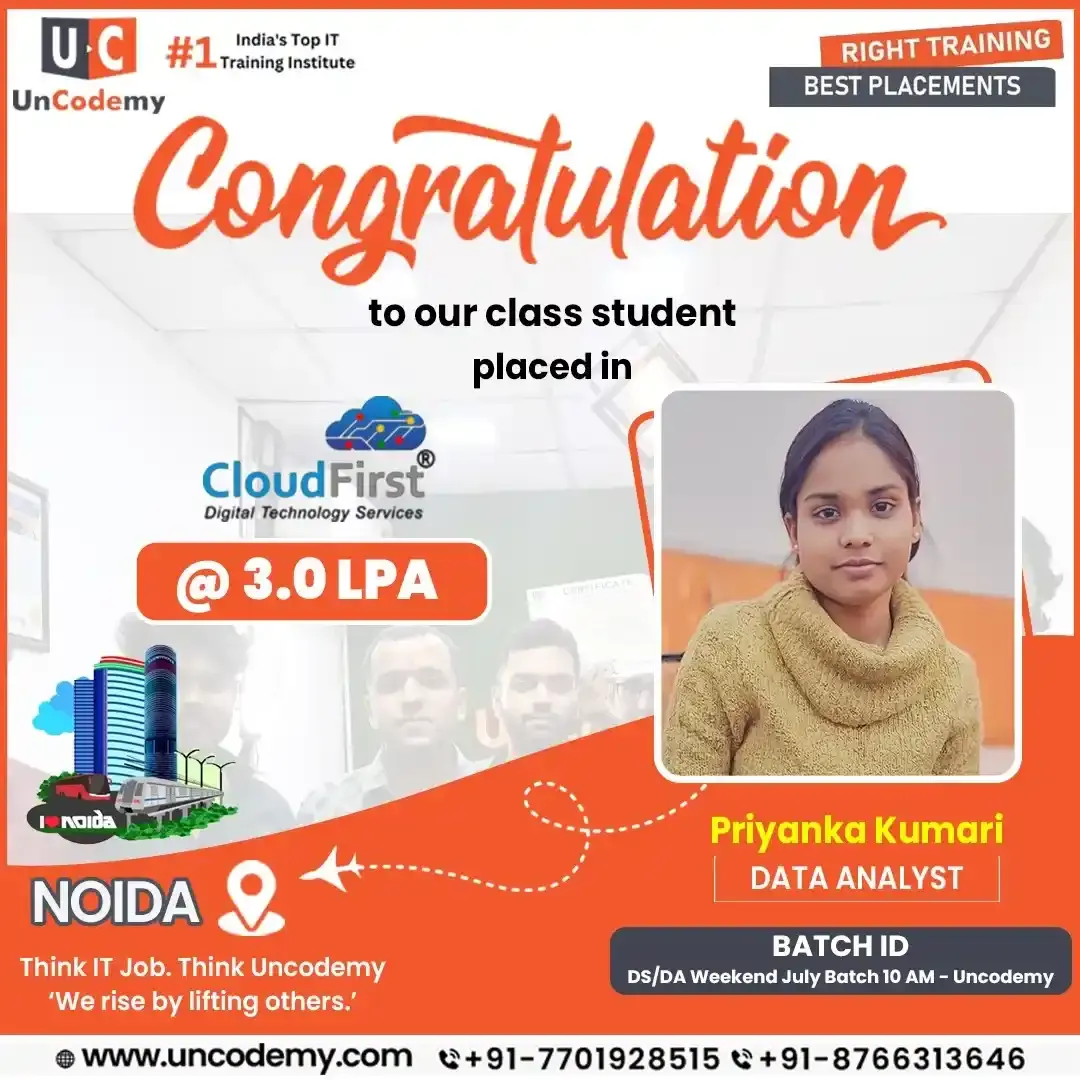
Priyanka Kumari, Data Analyst placed at CloudFirst Digital3.0 LPANoida

Priyanka Kumari

Data Analyst

Placed at
CloudFirst Digital
Program
Data Analytics Batch
Batch
DS/DA Weekend July Batch 10 AM
Read placement record
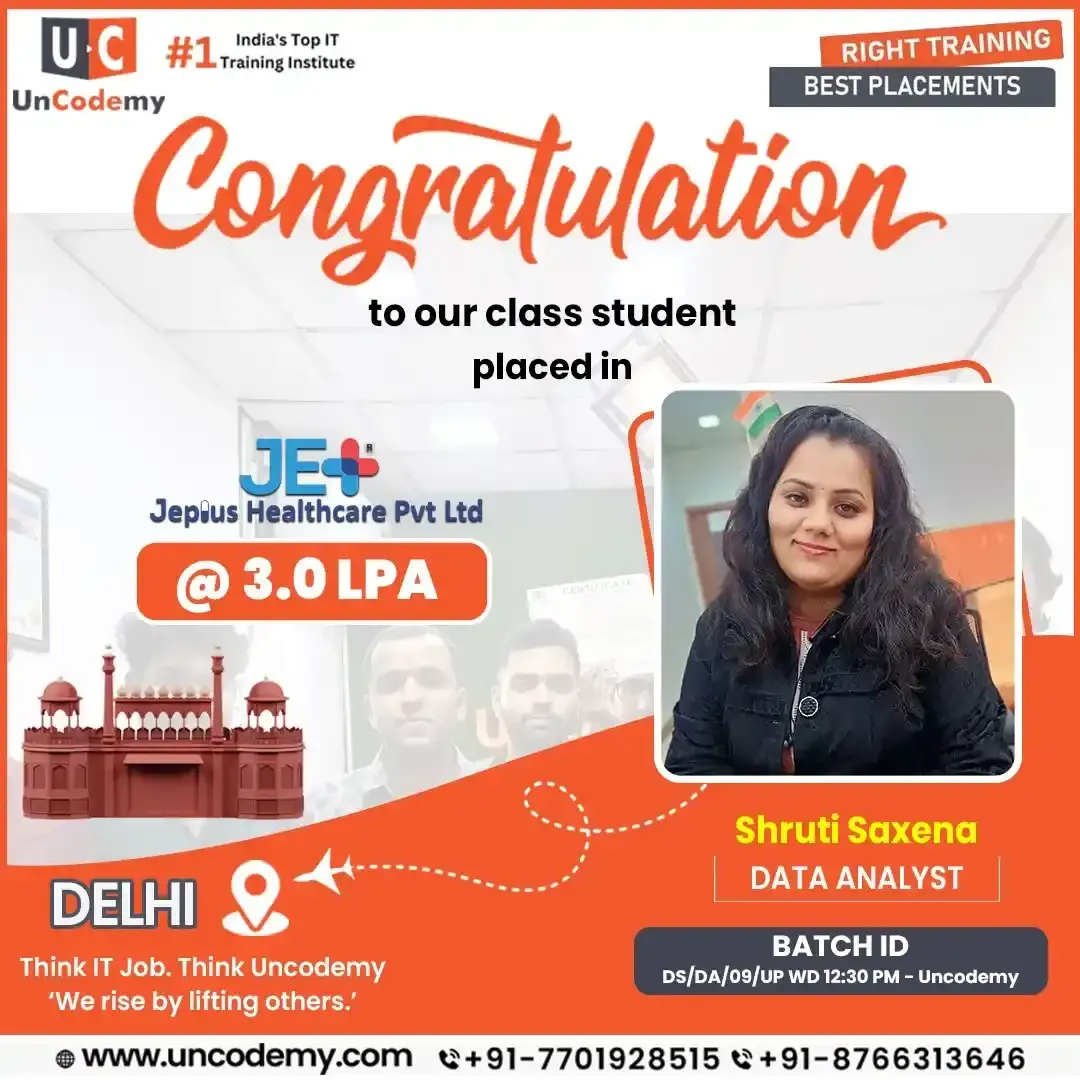
Shruti Saxena, Data Analyst placed at Jepius Healthcare3.0 LPADelhi

Shruti Saxena

Data Analyst

Placed at
Jepius Healthcare
Program
Data Analytics Batch
Batch
DS/DA/09/UP WD 12:30 PM
Read placement record

Location badges show where each learner was placed. Bareilly learners join these same live online batches and the same career-preparation process; outcomes depend on individual effort and the job market.

What is Data Analytics?

Think of a Bareilly furniture dealer who wants to know which designs sell before Diwali, or a zari exporter checking which buyers pay late. Data analytics is how you find out. You clean the records, test what they suggest using statistics and draw the answer as a chart that the owner understands at a glance. The same habit helps any organisation know its customers, follow its targets, plug leaks and plan for next season.

What does a data analyst do?

Your typical week as an analyst: write SQL to pull sales or billing data, sort out spelling mistakes and duplicate entries, compare months or branches in Excel or Python, put together a Power BI or Tableau view, then sit with the owner, accounts team or sales head and explain what to change. Half the job is the calculation; the other half is making sure people act on it.

Data Analytics vs Data Science vs Business Analytics

A sugar mill shows the three neatly. Analytics explains why crushing slowed last season; data science predicts how much cane will arrive next year; business analytics decides how to schedule shifts and payments to farmers.

AspectData AnalyticsData ScienceBusiness Analytics
Core questionWhat happened, and why?What will happen next?What should the business do?
Coding depthLow to moderateHighLow
Typical entry salary₹3–6 LPA₹8–18 LPA₹4–7 LPA
Time to job-ready6–7 months9–12 months5–6 months

The salary column gives rough first-job brackets taken from the cited sources; what you're actually offered depends on company, role, skill, experience, location and timing.

Course Overview

You'll spend 6–7 months on the course, joining 75+ live online classes that add up to more than 120 hours. Excel and SQL open the program, Python and statistics come next, then data cleaning and EDA, and finally Power BI, Tableau and Generative AI. Real datasets are used in every class, every phase ends with a guided build, and your capstone becomes the highlight of your portfolio.

  • Bareilly learners who'd like live teaching without packing up for Noida or Lucknow.
  • Graduates of MJP Rohilkhand University and nearby colleges — commerce, science, engineering, management or arts — who want an analytics career.
  • Staff in sugar mills, furniture and zari units or wholesale shops who already maintain registers and spreadsheets.
  • Bank, insurance and office employees ready to move from routine work into analysis.
  • MIS assistants wanting SQL, Python and dashboards on top of Excel.

Upcoming Data Analytics Course Batches in Bareilly

Pick a weekday or a weekend live batch, whichever fits your college, office or shop hours. If you want a taste first, a free online demo class is open to every Bareilly learner.

DateTimeTrainerSeats Left
19 Oct02:00 PM – 03:00 PMMr. Upendra02 Seats
02 Nov10:30 AM – 11:30 AMMs. Rachna01 Seat
09 Nov12:00 PM – 01:00 PMMr. Abhi02 Seats
16 Nov07:30 PM – 08:30 PMMr. Rahul01 Seat

Seats are limited and updated daily. All timings are in IST.

Data Analytics Course Syllabus & Curriculum in Bareilly

Nine modules carry you through 120+ hours in the same order a working analyst uses: get the data, clean it, analyse it, make sense of it, chart it and present it. You'll finish each module with a graded practical on genuine data, and the last module helps you package your best work into a portfolio.

Module 1: Excel for Data Analytics — 12 Hours

  • Advanced formulas: VLOOKUP, XLOOKUP, INDEX-MATCH, SUMIFS, COUNTIFS, nested IF
  • Data cleaning: text functions, Find & Replace, Flash Fill, removing duplicates
  • Pivot Tables, PivotCharts, Slicers and Timelines
  • Power Query for importing and transforming data
  • Data validation, conditional formatting and dashboard design
  • Charts: histogram, Pareto, combo, waterfall

Module 2: SQL & Database Management — 18 Hours

  • Relational database concepts, ER diagrams, normalisation
  • SELECT, WHERE, ORDER BY, GROUP BY, HAVING
  • All join types: inner, left, right, full outer, self, cross
  • Subqueries and Common Table Expressions
  • Window functions: ROW_NUMBER, RANK, LEAD, LAG
  • Connecting SQL databases to Python

Module 3: Python for Data Analytics — 20 Hours

  • Python fundamentals: variables, data types, loops, functions
  • Lists, tuples, dictionaries, sets, file operations
  • NumPy: arrays, vectorised operations, broadcasting
  • Pandas: Series, DataFrames, indexing, filtering, merging, grouping
  • Handling missing values and duplicates
  • Matplotlib, Seaborn and Jupyter Notebook

Module 4: Statistics & Business Mathematics — 12 Hours

  • Descriptive statistics: mean, median, variance, standard deviation
  • Probability fundamentals and data distributions
  • Sampling methods and the Central Limit Theorem
  • Hypothesis testing: p-values, confidence intervals, t-tests, chi-square, ANOVA
  • Correlation and regression basics
  • A/B testing in a business context

Module 5: Data Cleaning & Exploratory Data Analysis — 12 Hours

  • Data quality assessment and profiling
  • Handling missing values: deletion, imputation, flagging
  • Outlier detection and treatment
  • Feature creation and binning
  • Univariate, bivariate and multivariate analysis
  • Correlation heatmaps and structuring an EDA report

Module 6: Power BI — 18 Hours

  • Connecting to Excel, SQL, CSV and web sources
  • Power Query Editor, data modelling and relationships
  • DAX: calculated columns, measures, time intelligence
  • Visual types, filters, slicers, bookmarks and drill-through
  • Publishing to Power BI Service and scheduling refresh
  • Row-level security basics

Module 7: Tableau — 10 Hours

  • Tableau architecture, data connection and blending
  • Dimensions, measures and calculated fields
  • Filters, groups, sets and hierarchies
  • Parameters and dynamic controls
  • Reference lines, trend lines and forecasting
  • Dashboards, actions and stories

Module 8: AI & Gen AI for Data Analysts — 8 Hours

  • Prompt engineering for data tasks
  • Generating and debugging SQL and Python with AI assistance
  • Copilot in Excel and Power BI
  • AI-assisted insight summaries and report drafting
  • Verifying AI output: hallucinations, wrong aggregations, false confidence
  • Data privacy and what should never be pasted into a public AI tool

Module 9: Capstone Projects & Career Preparation — 10 Hours

  • End-to-end capstone project on a real business dataset
  • Building a GitHub portfolio and dashboard showcase
  • Analyst resume writing and LinkedIn optimisation
  • SQL and case-study interview practice
  • Mock interviews with feedback

Module · Topic · Hours · Tools

ModuleTopicHoursTools
1Excel for Data Analytics12Excel, Power Query
2SQL & Database Management18MySQL
3Python for Data Analytics20Python, Pandas, NumPy
4Statistics & Business Mathematics12Excel, Python
5Data Cleaning & EDA12Python, Pandas
6Power BI18Power BI Desktop
7Tableau10Tableau Public
8AI & Gen AI for Analysts8ChatGPT, Copilot
9Capstone & Career Prep10All tools
Total120 Hours10+ tools
IK
Curriculum Reviewed by

Irshad Khan — Senior Trainer, 8+ Years Experience. Specialization: Data Science, Data Analytics, Business Analyst, SQL, Power BI, Python, Generative AI, Agentic AI.

Get Your Data Analytics Certification In Bareilly

Complete the nine modules, the assignments and the capstone, and you'll receive the Uncodemy Data Analytics Program Certificate. It shows the program title, how long it ran, the tools you studied and the date you finished, and it carries a reference anyone can verify. It's issued only once your coursework and assessments are cleared.

Recruiters in Rohilkhand and beyond want proof, so you'll carry more than a certificate — a folder of graded spreadsheet, SQL, Python, statistics, BI and Gen AI assignments, topped by a capstone you planned and delivered alone.

Key Benefits of Our Data Analytics Certification:

  • Program Completion: Confirms you finished the full course, start to end.
  • Online Verification: A recruiter can check its reference online in seconds.
  • Practical Learning: Earned with real assignments and a capstone you scoped.

Your certificate can be verified by any employer, any time, on Uncodemy's official certificate portal.

Uncodemy Certificate Verification — Online Certificate Verification & Download: certificate.uncodemy.com
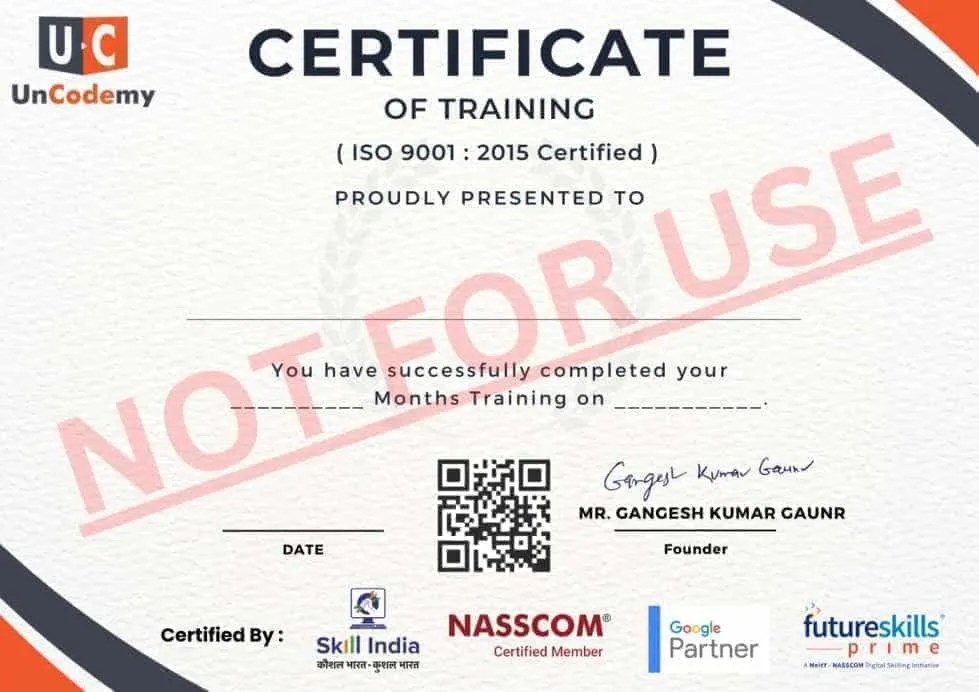
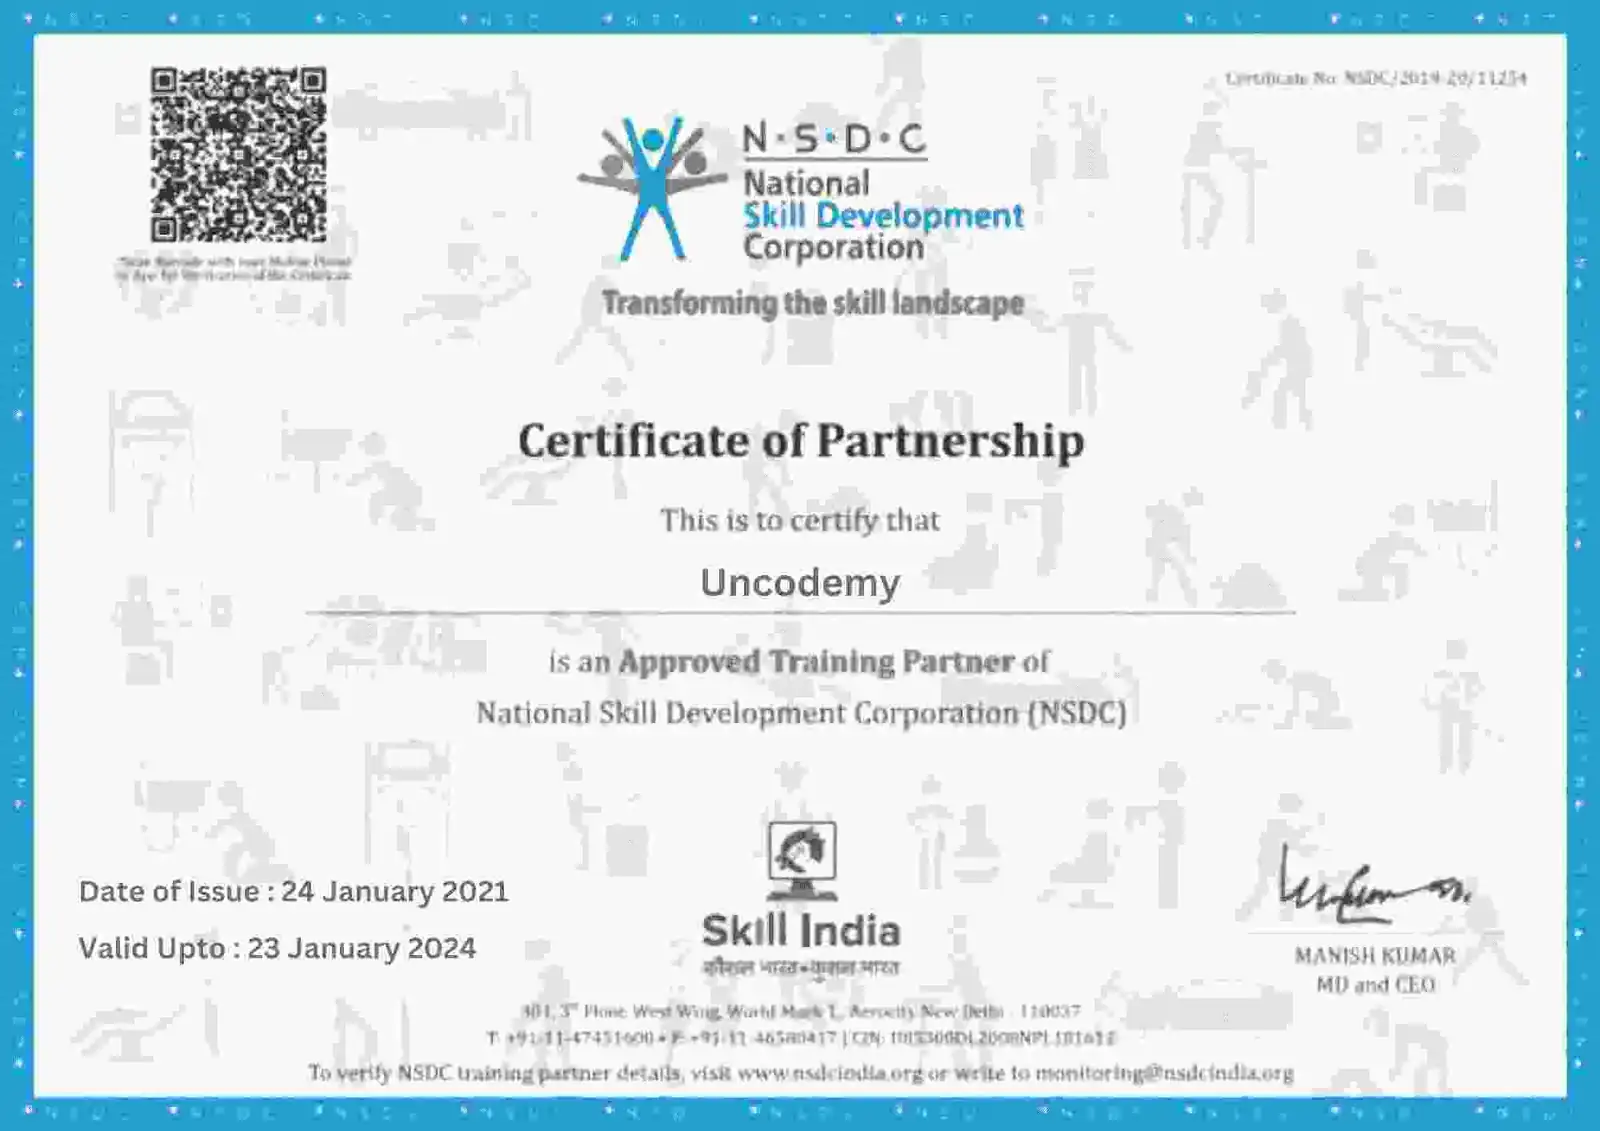
Sample Uncodemy Certificate of Training, marked not for use
Uncodemy Certificate of Training (sample)
NSDC Certificate of Partnership issued to Uncodemy
NSDC Certificate of Partnership
IIBA Endorsed Education Provider certificate issued to Uncodemy
IIBA Endorsed Education Provider

Tools and Technologies Covered

  • Excel
  • Tableau
  • Power BI
  • NumPy
  • Python
  • Pandas
  • SQL
  • Statistics
  • ChatGPT
  • Copilot

Introducing Uncodemy

Uncodemy is run by Uncodemy Edutech Pvt. Ltd., and it builds every course around one aim — helping you get hired. Classroom batches meet in Delhi and Noida, and live online batches bring the same lessons to Bareilly and cities all over India. You'll learn alongside beginners, fresh graduates, freshers and working people who want skills they can use straight away.

During the course you'll apply Excel, SQL, Python, statistics, Power BI, Tableau and Gen AI to real datasets through projects. It mirrors what analytics teams actually do — watch key numbers, keep dashboards current, write reports and back decisions — so your first job won't feel unfamiliar. You can read every module of the syllabus before signing up.

Each class is backed by live mentoring, practice tasks, projects, mock interviews and career guidance. Before you pay anything, you'll get the career support policy in writing, explaining what help is included, what isn't and who qualifies.

Other courses for Bareilly learners

If AI, Machine Learning, Data Science or Business Analysis interests you too, Bareilly learners can take any of those live online with Uncodemy.

Enroll in Our Data Analytics Training in Bareilly Today!

Get started from Bareilly — join live online classes, practise on real data, build a portfolio and prepare for analyst roles in Rohilkhand, NCR or remote teams.

Data Analyst Jobs and Career Scope in Bareilly & Rohilkhand

Bareilly's job market for data skills is smaller than a metro's but more varied than people assume. Sugar mills and distilleries across the district track cane arrivals, recovery and payments; rubber, plywood, furniture and food-processing units in the Parsakhera and CB Ganj industrial areas maintain production and dispatch data; and the city's huge wholesale trade in grain, cloth and FMCG moves through billing software that someone has to analyse.

Banks and NBFCs serving Rohilkhand, the cantonment and government offices, large hospitals and medical colleges, and coaching institutes add more openings. With the Delhi–Lucknow corridor close by, many Bareilly learners also aim for NCR, Lucknow or remote roles. Employers everywhere take SQL and a BI tool for granted; what wins the offer is being able to state the business question clearly, pick the right number and explain your recommendation simply.

Job Roles After This Course

Graduates usually go after Data Analyst, Business Analyst, MIS Executive/Analyst, Business Intelligence Analyst, Marketing/Product Analyst and Operations Analyst roles. A sugar mill will ask about recovery, a lender about defaults, a retailer about store sales — and you'll answer each with SQL, spreadsheets and a dashboard.

RoleCore Tools
Data AnalystSQL, Excel, Python, Power BI
Business AnalystSQL, Excel, BI tools
MIS Executive / AnalystExcel, SQL, Power BI
Business Intelligence AnalystPower BI, Tableau, SQL, DAX
Marketing / Product AnalystSQL, Python, BI tools
Operations AnalystExcel, SQL, Power BI

Most Bareilly freshers start as a Data, MIS or Business Analyst and, within two to four years, move into BI, product, marketing or operations analytics. You get there by owning full pieces of analysis and learning how your industry talks, not by collecting extra certificates.

Data Analyst Salary in Bareilly — Experience-wise

What you earn as an analyst depends on experience, industry and how good you really are with SQL and BI, and two people with the same title can be paid very differently. If you only build dashboards, you'll likely start low in the band; if you can also write efficient queries, untangle a vague request and argue for a decision, you'll start higher and grow faster.

Career Level / RoleIndicative Salary Range
Entry-Level Data Analyst₹3–6 LPA
Data Analyst (Mid-Level)₹6–10 LPA
Senior Data Analyst₹10–15 LPA
Business Intelligence Analyst₹7–12 LPA

Sources reviewed: AmbitionBox, Glassdoor, Indeed and Uncodemy placement records. Reviewed: 12 October 2026.

Bareilly-based employers usually start below NCR or Lucknow packages, while remote and big-city roles tend to sit higher in each band. Treat every range as a guide — role, skills, experience, location, employer and market all move it. Uncodemy doesn't guarantee any salary or job.

Top Hiring Sectors for Data Analysts in Bareilly & Rohilkhand

Uncodemy places learners through a network of more than 850 companies across India, from large firms to start-ups. If you're in Bareilly and Rohilkhand, analyst work is easiest to find in:

  1. Sugar, distilleries and agri-processing — cane arrival, recovery, payment and dispatch analysis

  2. Furniture, zari, plywood and rubber units — production, order and export tracking

  3. Wholesale and retail trade — billing, stock movement and credit control

  4. Banking, healthcare and education — loan, patient-flow and admissions dashboards

  5. NCR, Lucknow and remote openings — analytics roles with companies outside the city

Every sector looks for a slightly different mix of strengths, so pick one or two early and shape your portfolio around them.

How to Become a Data Analyst — Step by Step

Becoming an analyst is a staircase, not a jump — each step holds up the next. Skip one and you'll usually feel it in a technical interview or your first month at work, because employers test what you can actually do.

  1. 1

    Start with Excel — get quick with XLOOKUP, pivot tables and Power Query so a party-wise or month-wise summary takes minutes.

  2. 2

    Learn SQL properly — joins, grouped totals, subqueries and window functions; almost every interview begins here.

  3. 3

    Learn Python for the heavy stuff — when a mill's cane-arrival log runs into lakhs of rows, Pandas and NumPy handle it, and a short script rebuilds the weekly summary for you.

  4. 4

    Understand statistics — sampling, significance tests and regression output, so your conclusions hold up when someone pushes back.

  5. 5

    One dashboard tool, all the way — Power BI with DAX or Tableau with calculated fields, polished until a mill manager can explore it without you.

  6. 6

    Build a local portfolio — three to five projects, say cane-arrival trends or furniture sales by season, each ending with a recommendation.

  7. 7

    Apply with a plan — timed SQL practice, mock case chats and a CV and LinkedIn that show results, not just tool names.

Give yourself around six to seven months of steady practice; an hour most evenings will take you further than an occasional all-day session.

How This Course Compares to Other Data Analytics Courses in Bareilly

From ₹999 weekend crash courses to bootcamps costing lakhs, analytics training comes in all shapes, and every advert promises the same. So here, plainly, is what you get with Uncodemy.

FactorThis Program
Duration6–7 months
Learning hours120+ hours
Tools covered10+ tools
Gen AI moduleDedicated 8-hour module
Projects5 guided + 1 capstone
Career supportResume, LinkedIn, mock interviews, hiring network

Six to seven months may sound long beside a weekend workshop, but a fresher today might start a task in Excel, need SQL halfway, script part of it in Python and finish on a dashboard. Cheaper recorded courses exist; a shopkeeper who just wants neater Excel and Power BI reports could happily pick one.

Online vs Offline vs Hybrid — Which Should You Choose?

Format doesn't alter the syllabus, trainers, projects or fee, so go by convenience. For Rohilkhand learners, streaming the live classes from home makes most sense — no bus to catch, doubts sorted on the spot and timings that bend around college, office or the family shop.

Uncodemy's classrooms are in Noida and in Delhi's Shakarpur area, so hybrid only works if you visit NCR now and then. Learning online costs you nothing extra: you get the same live teaching, recordings, doubt sessions and placement support, and an allowed format switch keeps all your progress.

Is this course right for you?

If you want...Recommend
Only Excel + Power BI basicsA shorter course may be sufficient
Full analyst career transitionThis program
Heavy ML/Data ScienceChoose Data Science
Business-focused analyticsConsider Business Analytics
Self-paced learningRecorded course

Instructors for the Data Analytics Course in Bareilly

The people who teach Bareilly batches. There is no Uncodemy classroom in Bareilly, so learners from Bareilly & Rohilkhand join the live online batches taught by the same trainers who run classroom sessions in Delhi and Noida. The Data Analytics track is led by Irshad Khan, Senior Trainer, who reviewed and signed off this curriculum.

Technical content is checked separately by domain reviewer Upendra Kumar Tiwari, so the person teaching a topic is not the only one verifying it. When a learner from Bareilly wants a capstone built on furniture and bamboo crafts or sugar and agro-processing data, the trainer helps frame the questions, clean the dataset and design the dashboard.

Every trainer is listed by name on the Uncodemy trainers page, so you can check their background before you enrol.

Mr. Rahul

Mr. Rahul

Data Analytics Trainer

Expertise
SQLAdvanced ExcelPower BIPythonTableau

About

14+ years in banking and insurance operations at Aon Hewitt, NIIT Technologies and Coforge, now teaching Excel, SQL, Python and Power BI through real business scenarios.

Live projects

MIS reports and Excel dashboards for leadership tracking SLAs, error rates and backlog, SQL data cleaning and validation across systems, and live Power BI dashboards.

Mr. Anshul

Mr. Anshul

Data Analytics Trainer

Expertise
PythonSQLExcelPower BIData Visualization

About

5+ years across roles at Concentrix, Amazon and Tech Mahindra. A certified Data Scientist who now teaches data science and analytics as Academic Faculty at Uncodemy.

Live projects

Credit risk management analytics at Tech Mahindra, business communications analytics, and chatbot solutions built with prompt engineering and machine learning.

Mr. Upendra Kumar Tiwari

Mr. Upendra Kumar Tiwari

Senior Data Science Trainer

Expertise
Data ScienceData AnalyticsMachine Learning

About

15+ years of industry experience building production machine learning systems for retail, telecom and consulting teams.

Live projects

Modelling security breaches in iOS apps, dormant customer prediction and factor analysis, last-mile delivery optimisation, and credit card fraud detection.

Mr. Irshad Khan

Mr. Irshad Khan

Data Analytics & AI Trainer

Expertise
PythonSQLMachine LearningTableauArtificial IntelligenceDeep LearningPower BIMLOps

About

8+ years across consulting and public-sector analytics, with deep hands-on work in AI and MLOps delivery.

Live projects

Built an OCR model, a disease-prediction model, and a fraud-control model deployed across every Indian state under the Ministry of Health & Welfare.

Mr. Syed Najeeb

Mr. Syed Najeeb

Data Analytics & AI Trainer

Expertise
PythonMLDLNLPPower BITableauSPSSSASMS-ExcelSQLHTMLCSS

About

7+ years turning aviation and enterprise data into forecasting models, dashboards and AI assistants.

Live projects

AI agent chat/voice bot, AI-driven data analysis, a sales-forecasting ML model, NPS data model evaluation, and a face-recognition model for biometrics.

Mr. Kunal Arora

Mr. Kunal Arora

Data Analytics Trainer

Expertise
PythonSQLExcelPower BITableauMLDLNLPTime SeriesIoT DevicesPrompt EngineeringChatbots

About

5+ years in logistics and consumer-brand analytics, with a strong focus on time series, NLP and applied automation.

Live projects

Speech-to-text using core NLP (T2S), talent acquisition research, and product launch & CMS work on keventers.com using Sparktech.
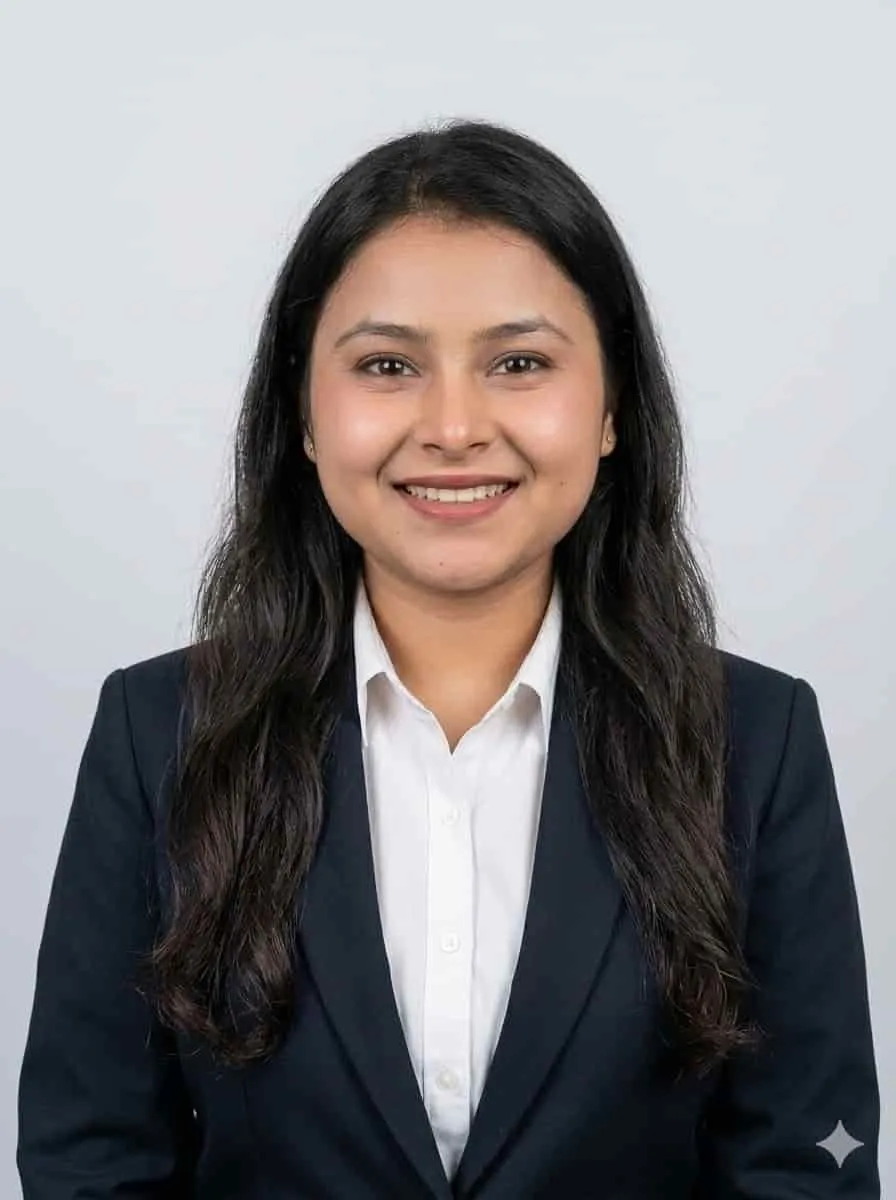
Ms. Rachna Verma

Ms. Rachna Verma

Data Analytics Trainer

Expertise
Advanced ExcelSQLPower BITableauPythonData VisualisationStatistics

About

Trainer for the analytics and business intelligence track at Uncodemy, working with learners on Excel, SQL and BI tooling from first principles to interview-ready projects.

Live projects

Guides classroom capstones on sales and customer dashboards, KPI reporting and end-to-end data cleaning workflows.

Mr. Abhi

Mr. Abhi

Data Analytics Trainer

Expertise
PythonSQLPower BIExcelTableau

About

3+ years building generative AI and machine learning systems, now Senior Gen AI Engineer at Uncodemy, with deep work in RAG, knowledge graphs, data analysis and AWS.

Live projects

NEMI, an enterprise memory system built on RAG, knowledge graphs and vector databases, plus automated web-scraping bots and generative AI chatbots and predictive analytics for startups.

Dr. Vijay K. Gupta

Dr. Vijay K. Gupta

MD & CEO

Expertise
EdTech LeadershipEducation & TrainingResearch & Mentorship

About

Founder, MD & CEO of Uncodemy and GS Net Academy, with experience in education, technology leadership, research, mentorship and career development.

Live projects

Leads strategic direction, academic initiatives, technology-driven education programs and mentorship across Uncodemy and GS Net Academy.

Gangesh Kumar Gaunr

Gangesh Kumar Gaunr

CEO & Founder

Expertise
Technology StrategyCloud & AI SolutionsEdTech Leadership

About

CEO & Founder of GvCloud Secure and Uncodemy with 14+ years of professional experience building scalable web, mobile and AI-driven solutions for clients across India, USA, UK, Canada, Australia and Singapore.

Live projects

Leads technology strategy, scalable web and mobile solutions, AI-driven products and EdTech initiatives across Uncodemy and GvCloud Secure.

Frequently Asked Questions

What is the duration of the Data Analytics course in Bareilly?

About six to seven months. You'll attend more than 75 live online classes — over 120 hours in all — in a weekday or weekend batch, whichever suits your routine in Bareilly.

Can I learn data analytics without a coding background?

Yes, absolutely. Lots of Bareilly learners join from B.Com, BA or a shop counter without ever writing code. Your first SQL lesson is a single SELECT line, Python starts with simple variables, and the first two months stay mostly in Excel and SQL.

What tools are covered in this course?

You'll work with ten-plus tools: SQL, Python, Pandas and NumPy to handle data; Statistics to reason about it; Excel, Power BI and Tableau to present it; and ChatGPT plus Copilot to speed things up.

Does the course include a Gen AI module?

Yes. Module 8 spends eight hours on AI for analysts — how to explain a data problem to ChatGPT, how to check the SQL or Python it gives you, how to use Copilot in Excel and Power BI, and how to catch numbers it gets wrong.

How many projects will I complete?

Six. Five are guided — retail, banking, HR, e-commerce and healthcare — and the sixth is a capstone you choose. A sugar-mill or furniture-sales dataset would make your Bareilly portfolio stand out.

Are the classes live or pre-recorded?

There are no pre-recorded lectures in this course. Your trainer teaches each of the 75+ sessions live, and the recording is posted later for revision; classroom, online and hybrid groups study the same syllabus.

What is the fee for the Data Analytics course in Bareilly?

Everything comes to ₹20,650 — that's ₹17,500 plus 18% GST — with notes, project reviews, certification and placement help already inside. Paying in parts? Monthly EMIs open at ₹4,032.

Are EMI options available?

It is. Instalments start from ₹4,032 a month, and your counsellor settles the tenure, final EMI and approval with whichever lender you're comfortable with.

Is there a demo class before I enrol?

Yes. Book a free live demo from Bareilly, watch a trainer teach, ask your own questions and look through the syllabus before you pay anything. Call or WhatsApp us to fix a time.

Do you provide placement assistance?

Yes. Our career team polishes your resume and LinkedIn, reviews your portfolio, runs mock interviews and shares openings from more than 850 companies. Employers make the final hiring call, so we can't promise you a job.

Can a fresher get a data analyst job after this course?

Definitely possible. Sugar mills, wholesale firms, lenders and work-from-home analytics teams hire freshers who can prove SQL, a BI tool and real projects — the three things you'll build here. Opening salaries usually sit near ₹3–6 LPA.

What is the salary of a data analyst in Bareilly?

As a rough guide: ₹3–6 LPA when you start, ₹6–10 LPA after a few years and ₹10–15 LPA at senior level. Bareilly jobs may pay less than NCR or remote ones for the same title, and Uncodemy can't guarantee any figure.

What job roles can I apply for after this course?

In Rohilkhand the usual first title is Data Analyst, MIS Analyst or Business Analyst. A few years on, people branch into BI engineering, reporting leadership, product or marketing analytics, or operations analysis.

Who is eligible for this Data Analytics course?

If you've finished a bachelor's degree in any subject, you can join. No coding or analytics background is needed, and Bareilly batches usually mix students, working staff and career changers.

Are the salary, placement and review figures on this page guaranteed?

Treat them as signposts, not promises. They come from our placement records and public review platforms, which keep changing. Your own outcome depends on your skill, background, city, the employer and timing; lenders decide EMI eligibility.

Is classroom training available in Bareilly?

No. Uncodemy teaches in person only in Delhi and Noida, so you'll join the same batches live online from Bareilly. If you're ever in Delhi, our centre is in Shakarpur Extension, a short walk from Nirman Vihar Metro.

Which companies hire Uncodemy learners?

The recruiter pool is 850-plus strong — Genpact, Fiserv, upGrad, Clarivate and HSBC among them. On our books: a Clarivate Intellectual Property Analyst, a Genpact Process Developer Analyst, and Business Analysts placed with HSBC and Fiserv.

Student Project For Data Analytics

These five capstones were built by Uncodemy learners and mentored by our trainers. Each card shows the tools used, the mentor, the learner who built it and a Bareilly version you can attempt with local data.

UncodemyDATA ANALYTICS

Sales Analysis Dashboard

You'll clean and join raw sales tables in SQL Server, then build an interactive Power BI dashboard — regional map, monthly trend, product drill-down — where every chart answers a written requirement.

Bareilly version: Run the same SQL Server + Power BI pipeline on furniture and bamboo crafts sales from Bareilly and compare months, products and outlets.

PythonExcelPower BISQL
Ms. Rachna VermaMs. Rachna VermaData Analytics Trainer
Sagar Bajirao ShembadeSagar Bajirao ShembadeData Analyst
UncodemyDATA ANALYST

Music Store Analysis

You'll sketch an entity diagram for an online music shop, build the PostgreSQL tables in PgAdmin4 and query them to see which genres earn, which customers return and where sales could grow.

Bareilly version: Model a zari-zardozi and retail trade catalogue the same way and rank items, customers and areas of Bareilly & Rohilkhand by revenue.

Power BIDAXCSVGitHub
Dr. Vijay K. GuptaDr. Vijay K. GuptaMD & CEO
Ankit SinghAnkit SinghData Analyst
UncodemyDATA ANALYTICS

Covid 19 Pandemic Analysis

You'll take public COVID-19 data, fix its gaps in Pandas, compute rates with NumPy and plot state-wise waves in Matplotlib inside Jupyter.

Bareilly version: Clean and chart public health or footfall data for Bareilly & Rohilkhand with the same Pandas and Matplotlib workflow.

PythonPandasJupyter NotebookGitHub

Mr. Upendra Kumar TiwariMr. Upendra Kumar TiwariSenior Data Science Trainer

Shruti SaxenaShruti SaxenaData Analyst
UncodemyDATA ANALYTICS

Company Insights 360°

You'll connect Python scripts, SQL tables and Power BI pages into one reporting pack covering staff, sales and performance for a made-up company.

Bareilly version: Build a scorecard of sugar and agro-processing employers around Bareilly — size, hiring trend and pay bands — with SQL and DAX.

PythonSQLPower BIDAX
Ms. Rachna VermaMs. Rachna VermaData Analytics Trainer
Rajat KashyapRajat KashyapData Analyst
UncodemyDATA ANALYTICS

IPL Analysis Dashboard

You'll turn several seasons of IPL scorecards from raw CSV into statistics and a gallery of 44+ charts on batsmen, bowlers, grounds and teams.

Bareilly version: Swap IPL data for furniture and bamboo crafts seasonality in Bareilly and show peaks, slumps and outliers in one dashboard.

PythonJupyter NotebookPower BISQL
Mr. Upendra Kumar TiwariMr. Upendra Kumar TiwariSenior Data Science Trainer

Pawan MehraPawan MehraData Analyst

Why Trust This Page? Discover Why Students Choose Uncodemy

  • Course curriculum verified by Mr. Irshad Khan.
  • Technical content verified by Mr. Upendra Kumar Tiwari.
  • Fee verified by Admin Department.
  • Placement figures sourced from internal placement records.
  • Review counts verified against respective third-party platforms.