


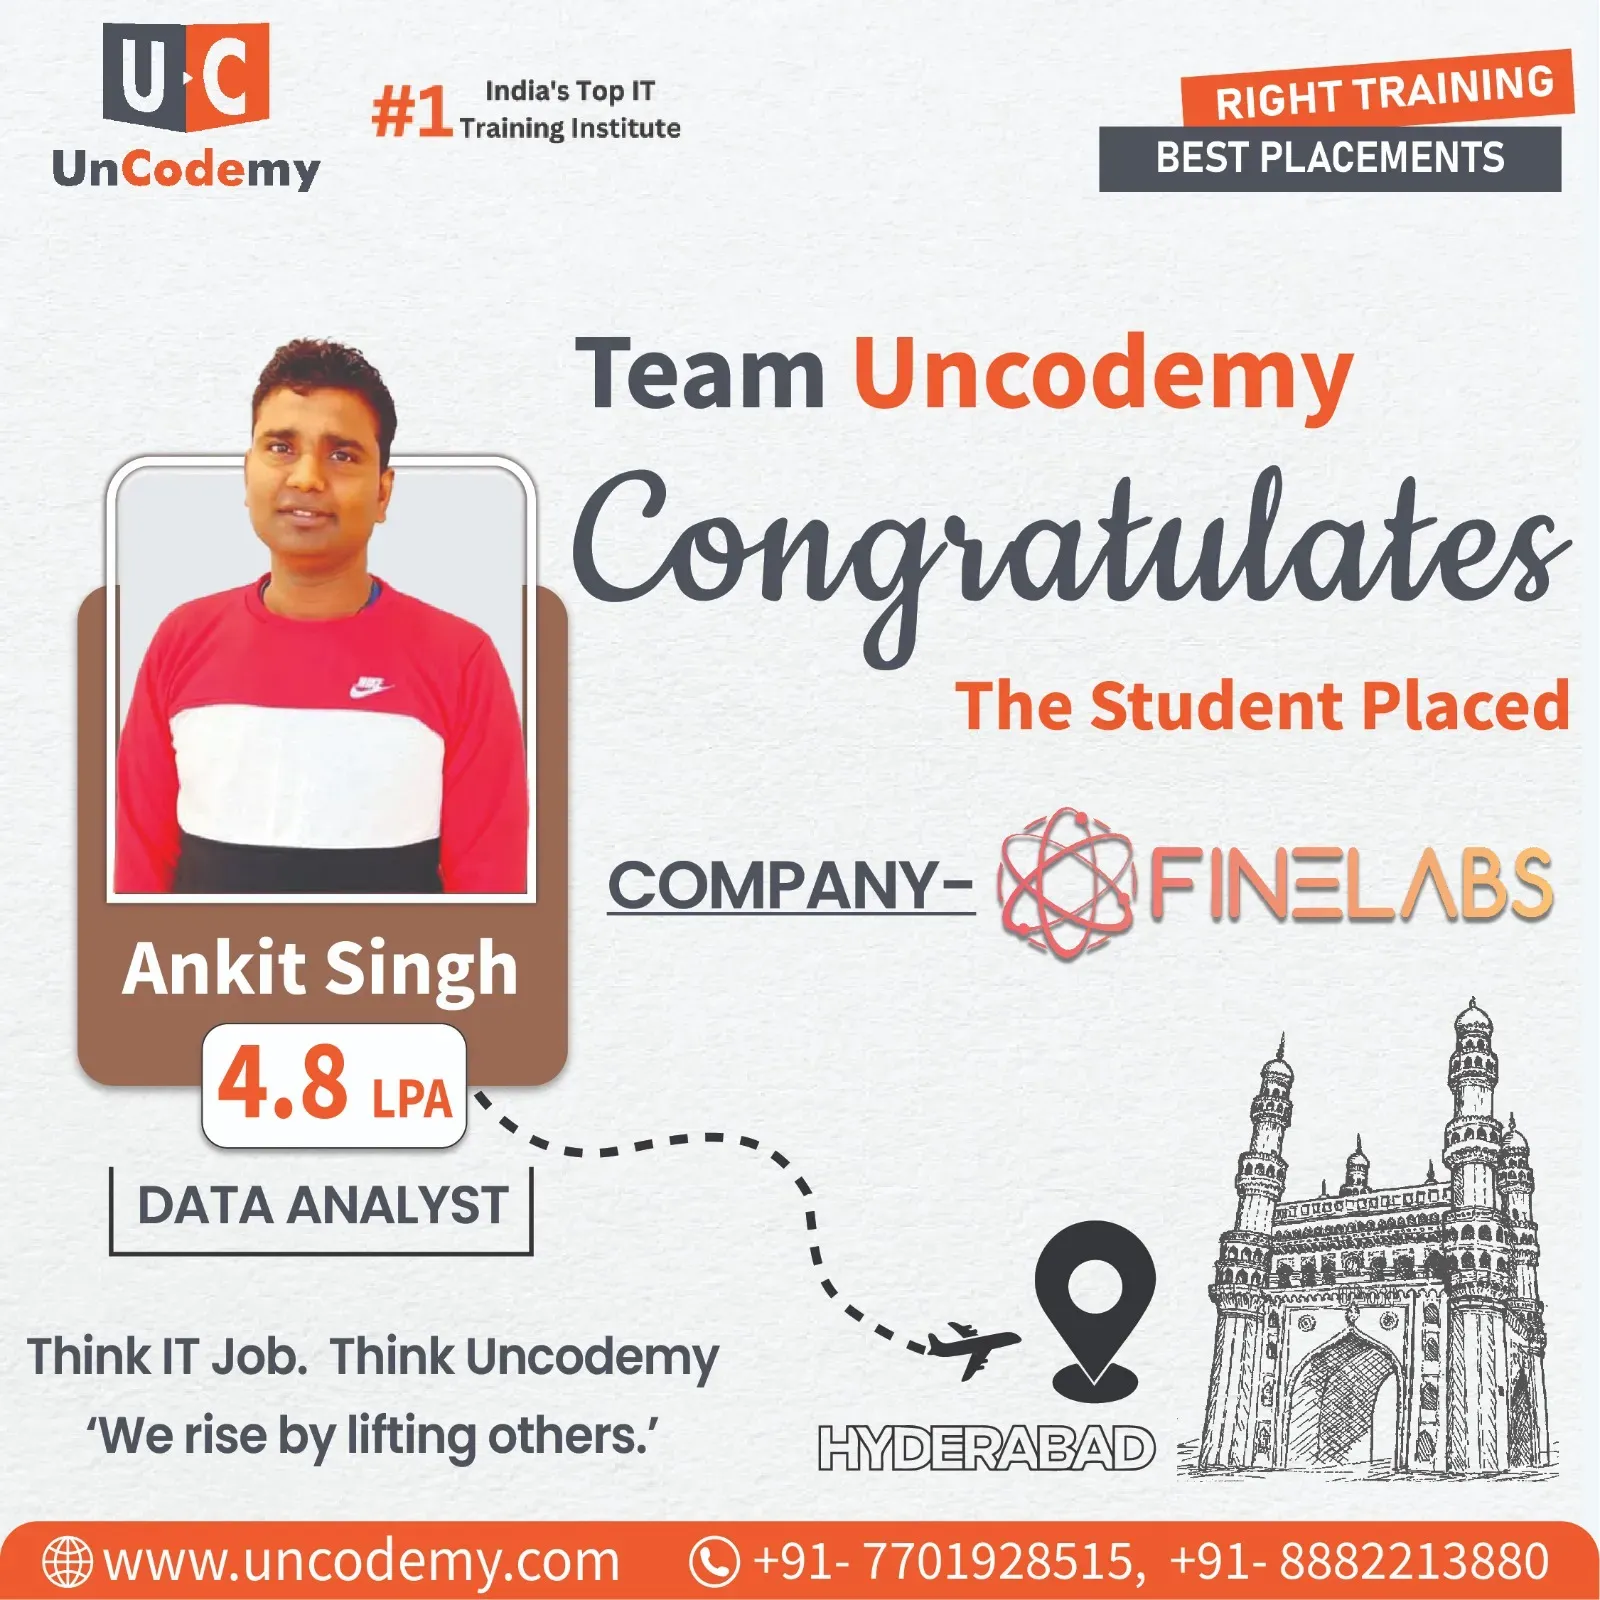
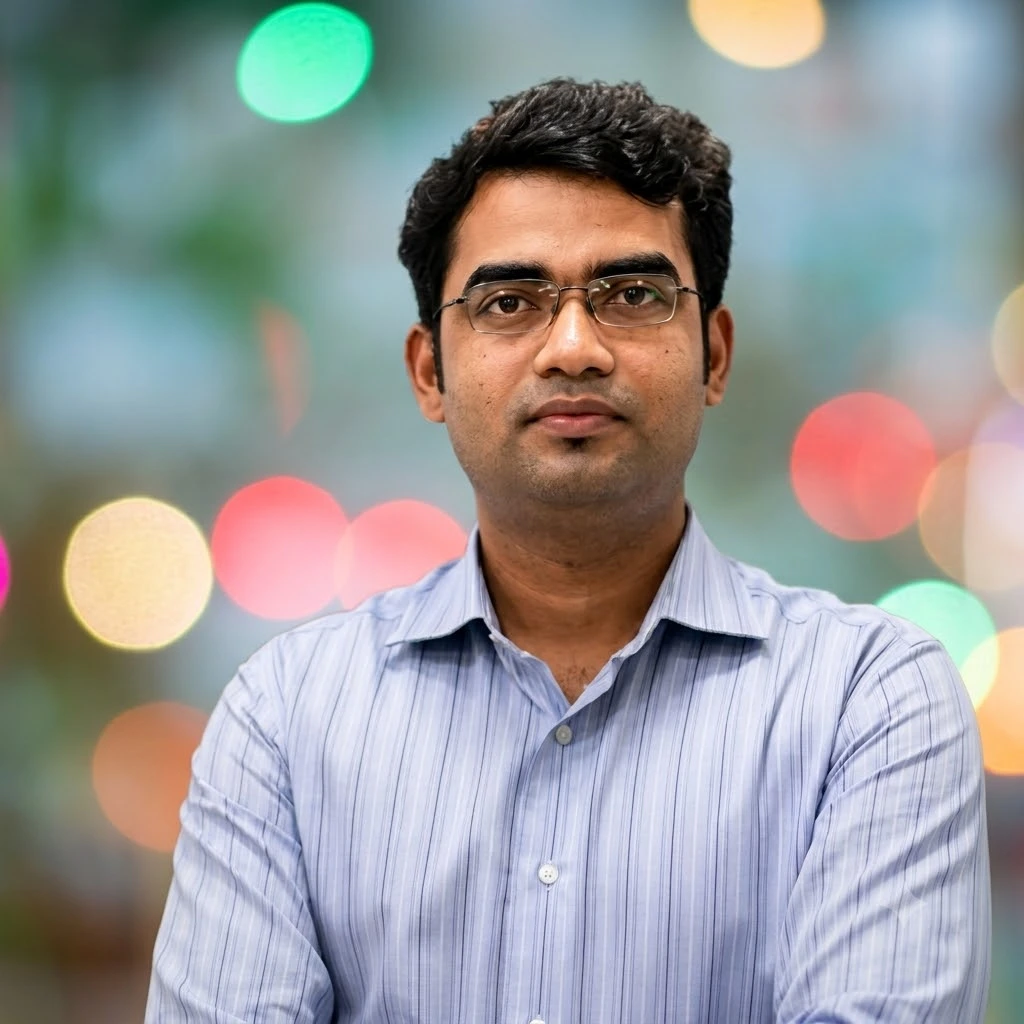
 4.8 LPAHyderabad
Ankit Singh
Data Analyst
- Placed at
- FINELABS
- Program
- Data Analytics Batch
- Batch
- DA/09/0823/S WD 7PM

Choose the best training program according to your career.

Improve the performance of your business with our innovative Industrial Training Program.
Read More →
Our instructor-led training classes are designed to make you an expert.
Read More →
Real-life case studies are a great way to demonstrate your practical knowledge.
Read More →
Explore blogs, latest technologies and industry updates with practical examples.
Read More →
Browse all available training programs and choose the right one for your career.
Read More →Know more about who we are and what we stand for.
Discover our mission to equip individuals with essential IT skills and industry expertise.
Read More →Learn, practice and plan your career — bilkul free.
Book a free video counselling session and pick the right course for you.
Read More →Mathura and Vrindavan draw crores of pilgrims, the Mathura refinery processes millions of tonnes of crude, and Braj's dairies and sweet-makers feed half of western UP. All three run on numbers. Uncodemy's Data Analytics Course gives Braj learners the skills to work with those numbers. It's a 6–7 month live online program: a trainer teaches Excel, SQL, Python, Statistics, Power BI, Tableau and Generative AI, and you practise every tool on realistic business data.
Uncodemy's classrooms are in Delhi and Noida — nowhere else. The Delhi centre is at Shakarpur Extension, beside DSEU Ambedkar College, a short walk from the Nirman Vihar and Laxmi Nagar Metro Stations. Mathura learners join those same batches live online. Included: 120+ hours of learning, 75+ trainer sessions, real projects and a personal placement mentor. Fee: ₹17,500 + 18% GST = ₹20,650.
Braj learners follow a six-to-seven-month live online timetable. Excel comes first, then SQL, Python and statistics, then Power BI, Tableau and Gen AI. Practice datasets are drawn from pilgrim tourism, milk cooperatives and refinery services. A mentor checks in every few weeks, and the final stretch is dedicated to mock interviews and CV work.
Finish the course and you can take a raw ledger, footfall log or plant report and turn it into a clean, analysed, clearly presented answer. Eligible learners then apply for analyst jobs after career prep. A few logged results are below.
4.8 LPAHyderabadData Analyst
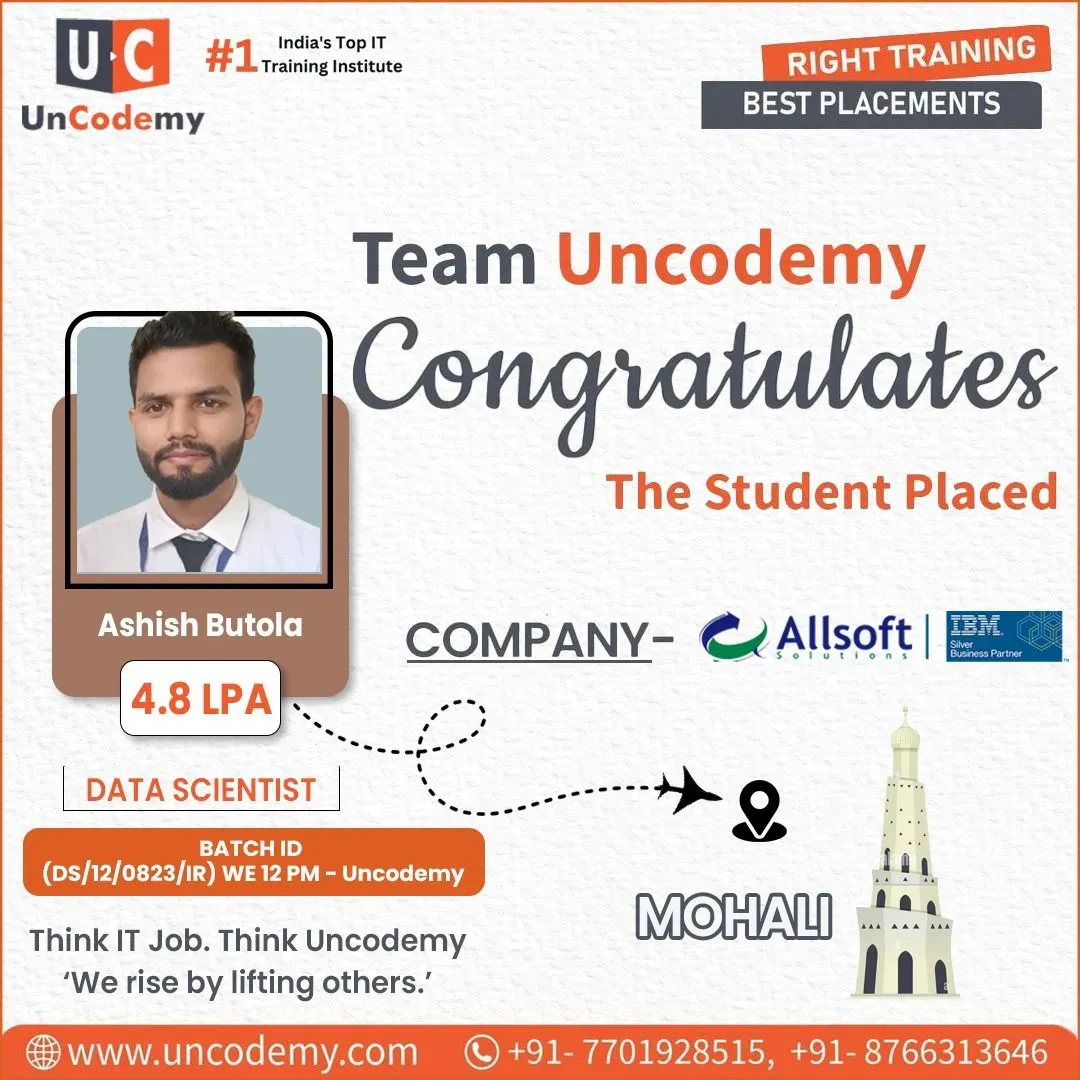 4.8 LPAIndia
Data Analyst
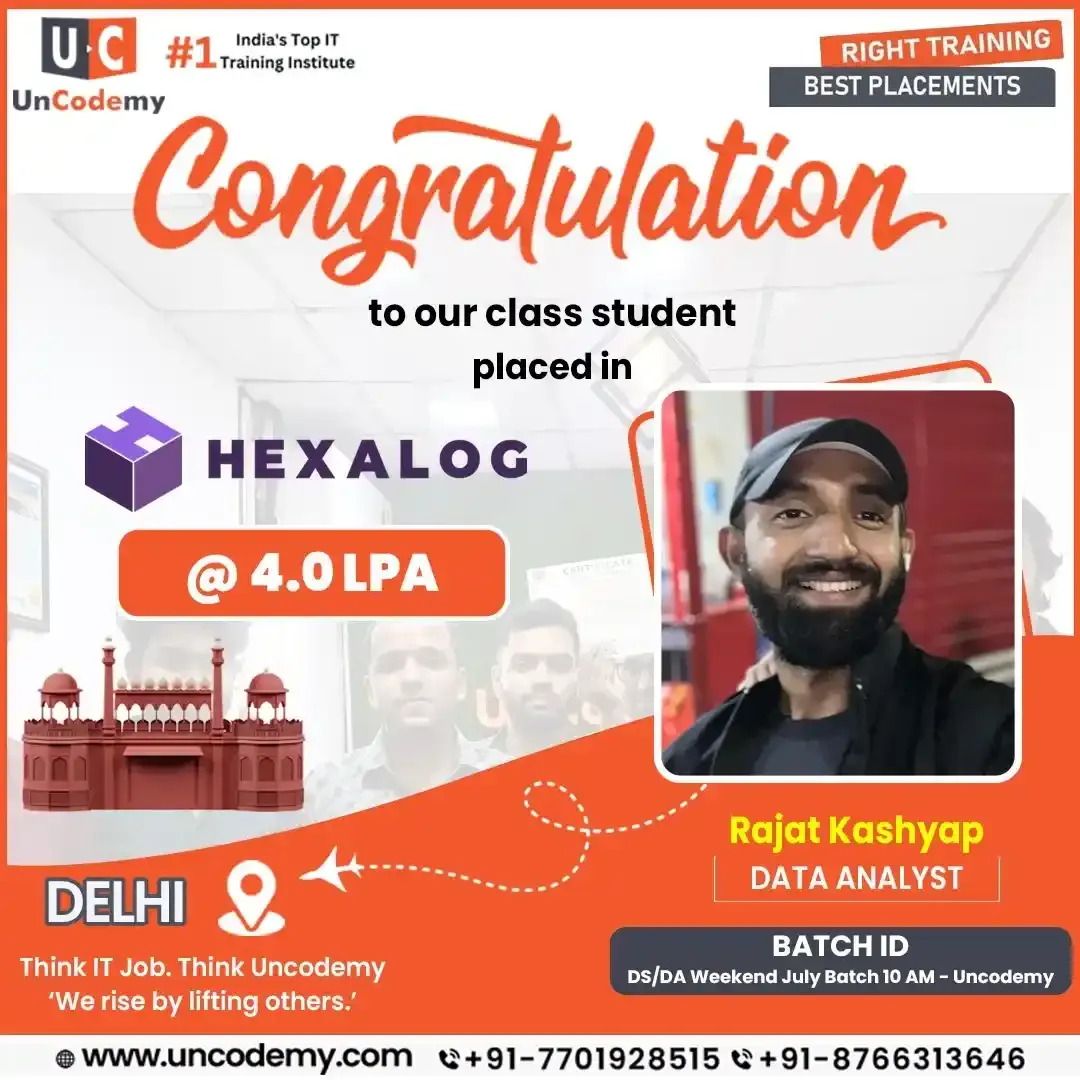 4.0 LPADelhi
Data Analyst
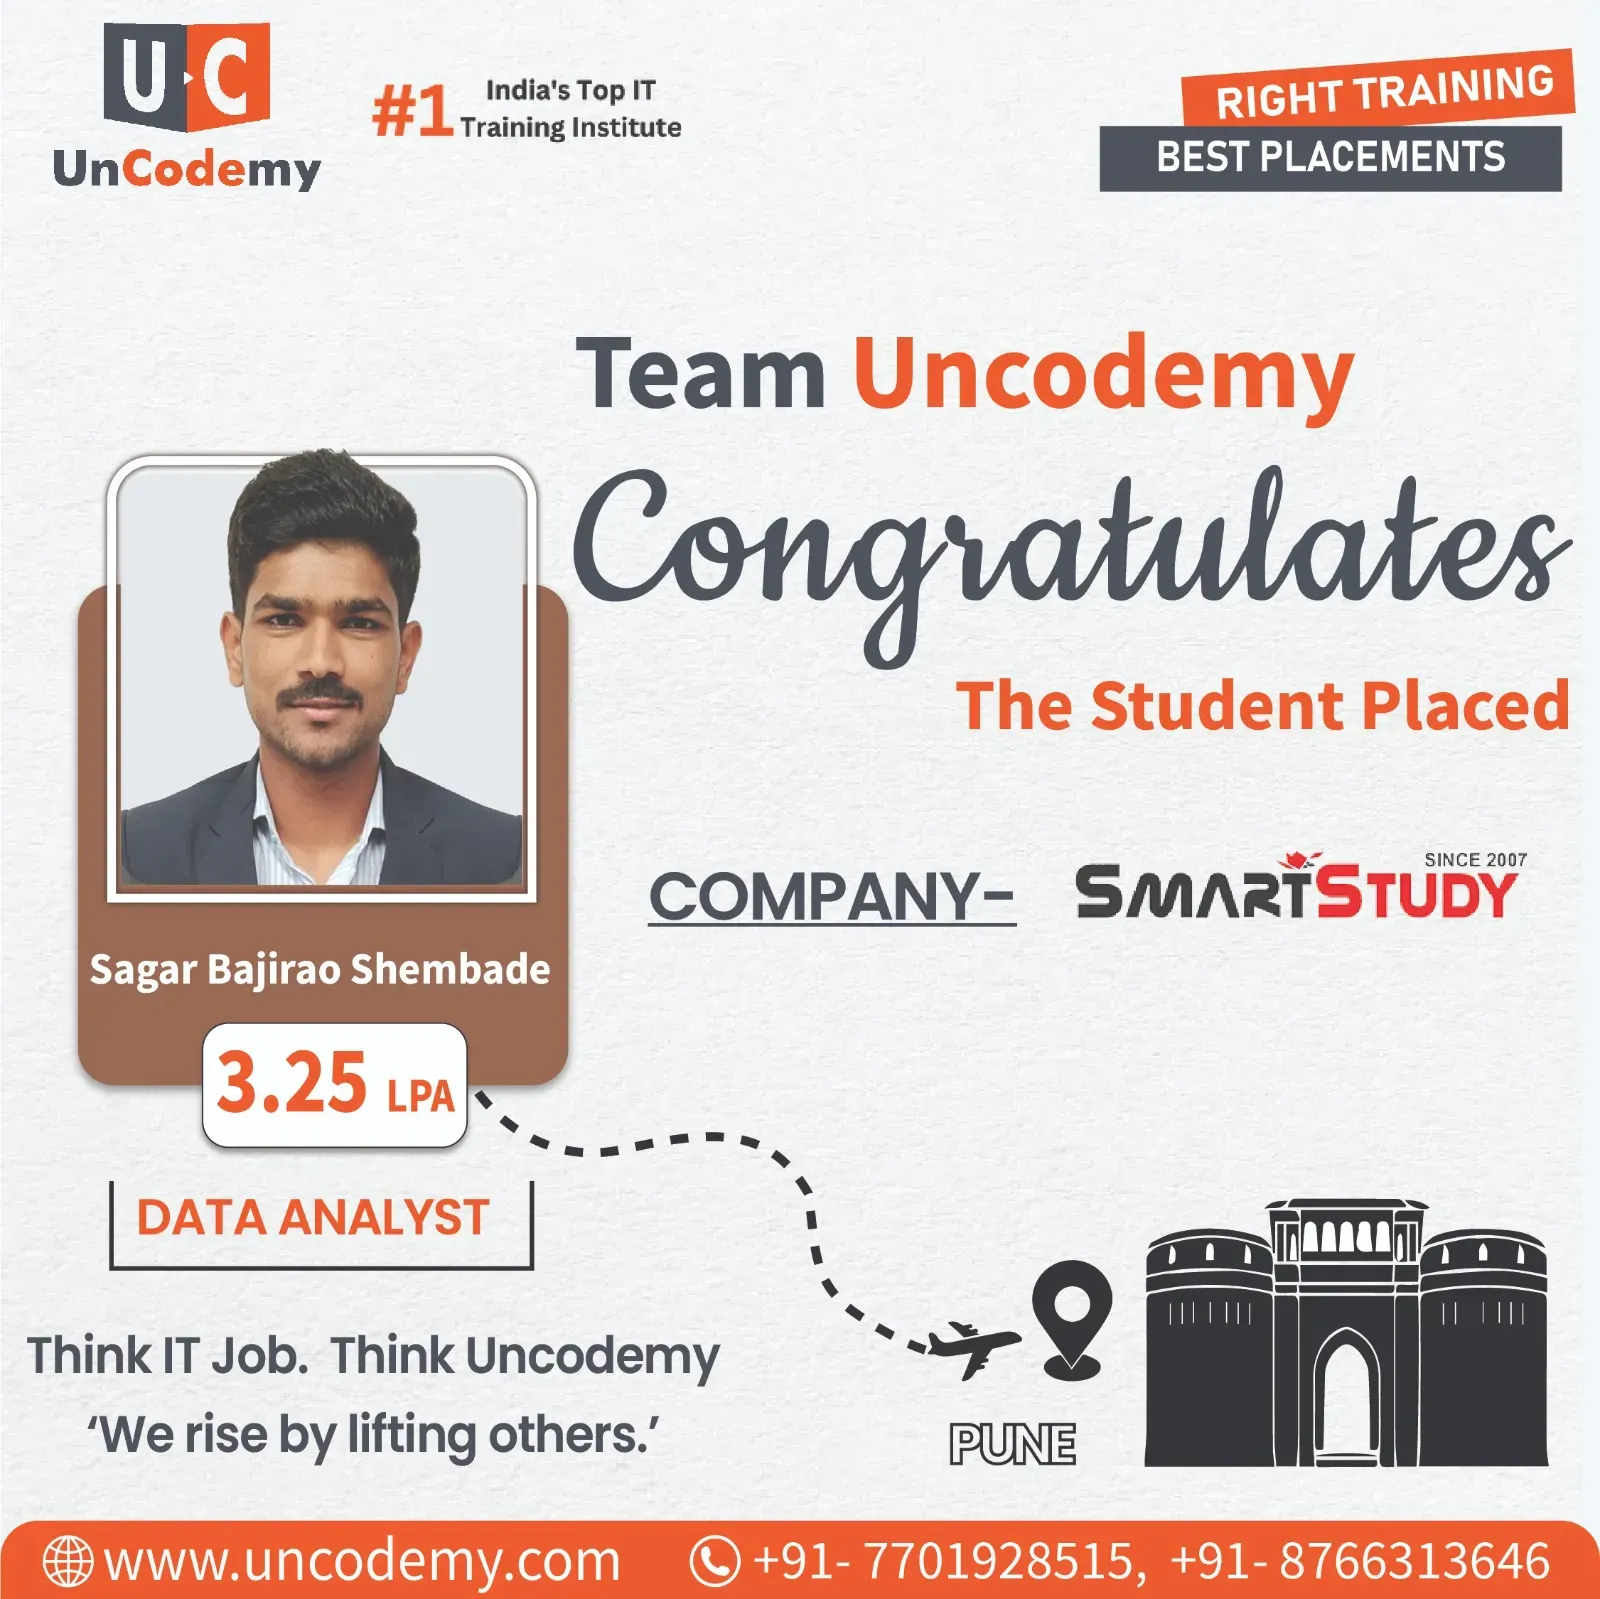 3.25 LPAPune
Data Analyst
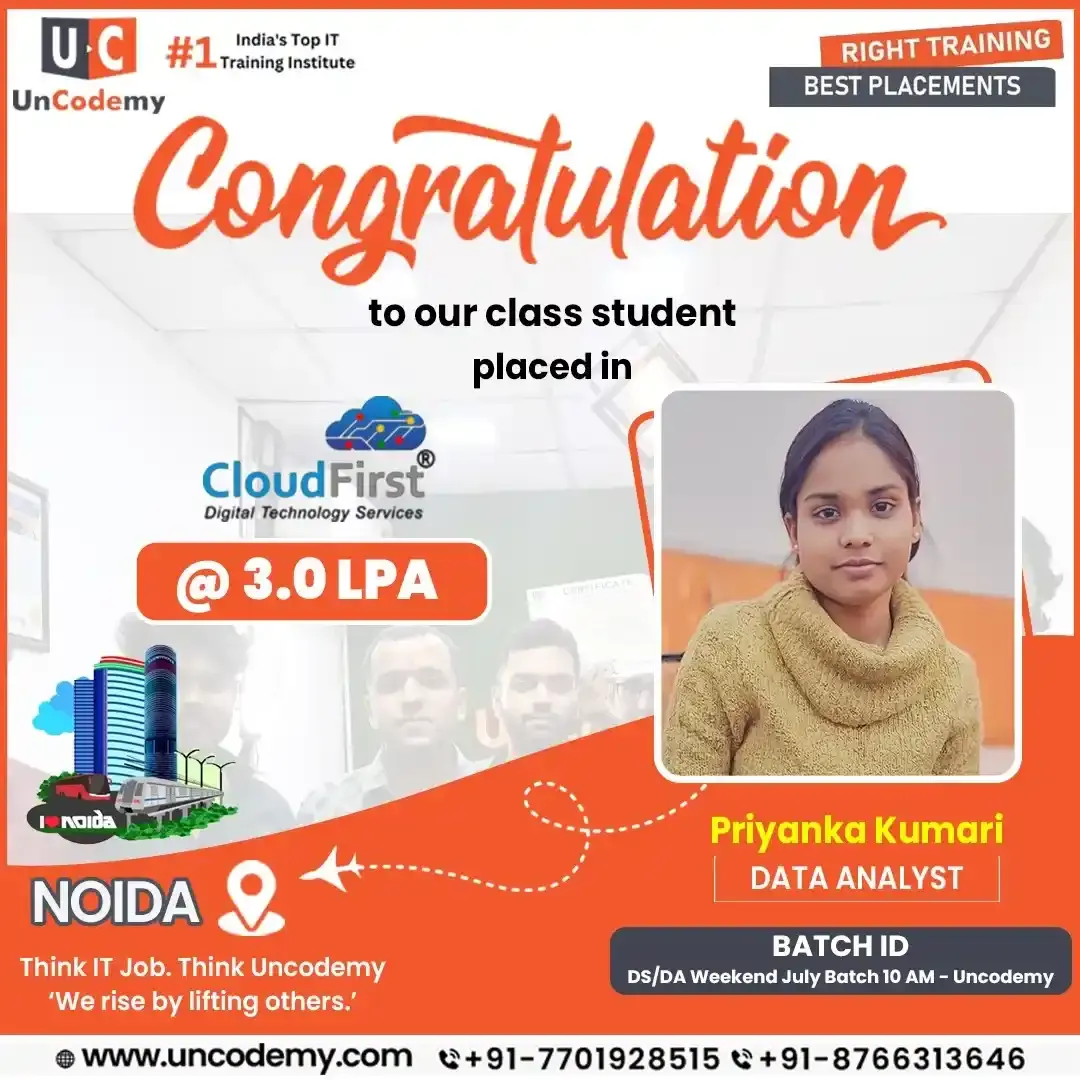 3.0 LPANoida
Data Analyst
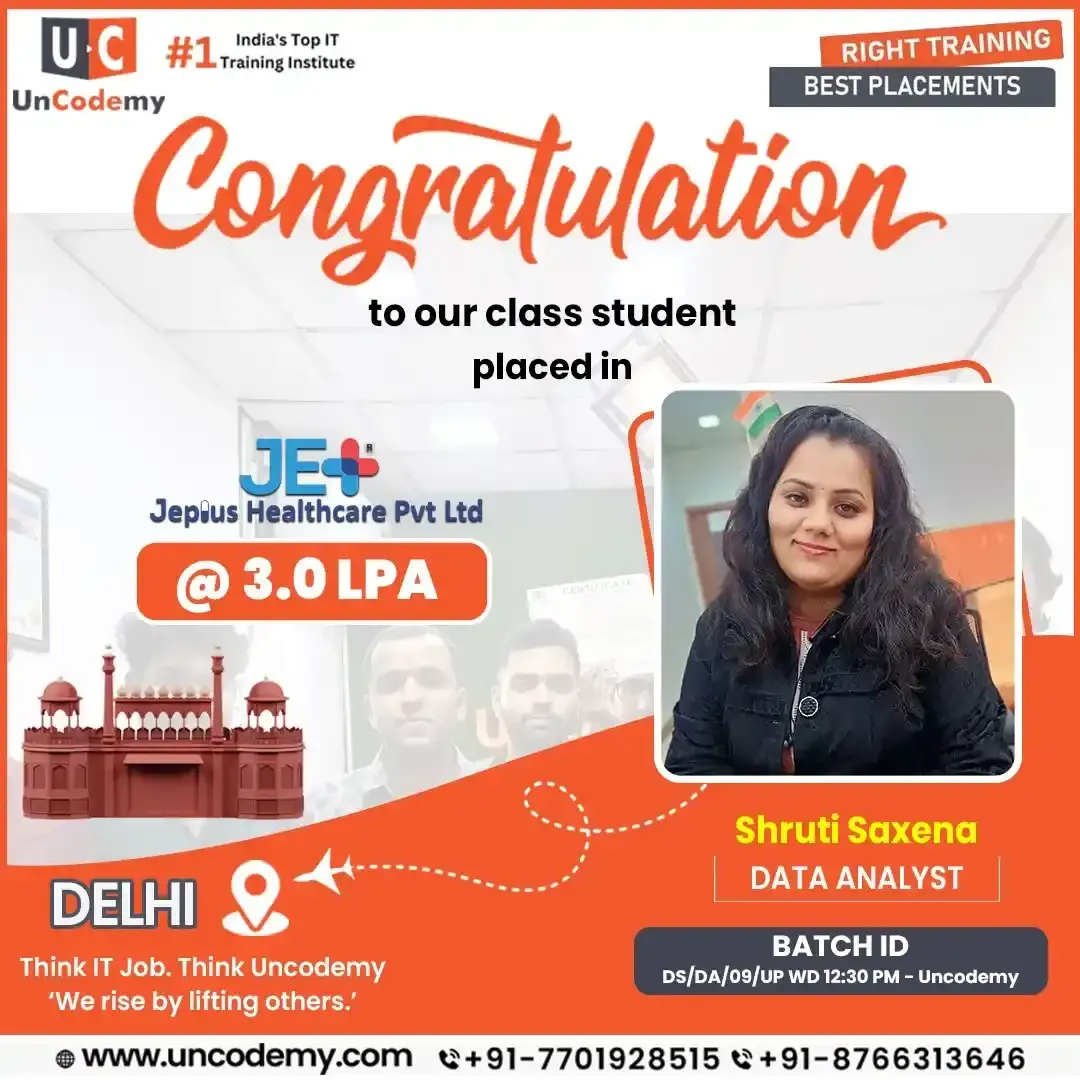 3.0 LPADelhi
Data Analyst
Location badges show where each learner was placed. Mathura learners join these same live online batches and the same career-preparation process; outcomes depend on individual effort and the job market.
Data analytics is simple to describe and powerful in practice. Take raw records. Clean them. Test what they show. Chart the answer so anyone can follow it. A Vrindavan guest house can learn which weekends fill up and which sit empty; a peda maker can see which outlets sell most during Holi; a refinery contractor can find out which pumps fail most often and why. Every organisation — temple trust, dairy union, hospital or bank — can use the same method to understand people, track results, cut waste and plan the next season.
A week in the job looks something like this. Monday: pull last month's data with SQL. Tuesday: fix the blanks, typos and duplicate entries. Wednesday: compare months, outlets or machines in Excel or Python. Thursday: build a clean Power BI or Tableau page. Friday: sit with the owner, accountant, sales lead or plant engineer, explain what the numbers say and agree on what to do next. Being able to explain clearly is as important as getting the maths right.
Use a temple-town hotel as the example. Analytics: why did Janmashtami bookings dip last year? Data science: how full will we be at Holi? Business analytics: what should we charge, and how many staff do we need?
AspectFigures in the salary row are approximate starting brackets from the referenced sources. Real offers shift with employer, designation, skill level, experience, city and hiring season.
Plan for 6–7 months, 75+ live online classes and more than 120 hours of learning. You start with Excel and SQL, the tools most Braj businesses already touch. Then come Python, statistics, data cleaning and exploratory analysis. The last phase covers Power BI, Tableau and Generative AI. Real data appears in every class, each phase ends with a guided project, and your capstone becomes the first thing you show recruiters.
Eligibility: Any bachelor's degree, in any subject (full details on the eligibility criteria page). You don't need to know coding — SQL and Python are taught from the very first line. Basic comfort with numbers helps, and the statistics module rebuilds every idea it uses. Keep a laptop with 8GB RAM and a stable internet connection ready for practical classes.
Weekday and weekend live batches are open to Mathura learners, timed around college, shifts and festival seasons. Try a free online demo first if you like.
Seats are limited and updated daily. All timings are in IST.
Nine modules, more than 120 hours, arranged in the order real analytics work happens: collect the data, clean it, analyse it, interpret it, visualise it and present it. Every module ends with a graded practical on genuine data. The ninth module brings your strongest pieces together into a portfolio you can share with employers.
| Module | Topic | Hours | Tools |
|---|---|---|---|
| 1 | Excel for Data Analytics | 12 | Excel, Power Query |
| 2 | SQL & Database Management | 18 | MySQL |
| 3 | Python for Data Analytics | 20 | Python, Pandas, NumPy |
| 4 | Statistics & Business Mathematics | 12 | Excel, Python |
| 5 | Data Cleaning & EDA | 12 | Python, Pandas |
| 6 | Power BI | 18 | Power BI Desktop |
| 7 | Tableau | 10 | Tableau Public |
| 8 | AI & Gen AI for Analysts | 8 | ChatGPT, Copilot |
| 9 | Capstone & Career Prep | 10 | All tools |
| Total | 120 Hours | 10+ tools |
Irshad Khan — Senior Trainer, 8+ Years Experience. Specialization: Data Science, Data Analytics, Business Analyst, SQL, Power BI, Python, Generative AI, Agentic AI.
Clear all nine modules, every assignment and the capstone, and you receive the Uncodemy Data Analytics Program Certificate. It lists the program, duration, tools and completion date, plus a verification reference. No certificate is issued until coursework and assessments are done.
Hiring managers in Braj and NCR rarely stop at the certificate. They ask to see work. You'll have it: marked spreadsheet, SQL, Python, statistics, BI and Gen AI assignments, plus a capstone you scoped, built and presented alone.
Employers can verify a Mathura learner's certificate online, any time, on Uncodemy's official certificate portal.
Uncodemy Certificate Verification — Online Certificate Verification & Download: certificate.uncodemy.com
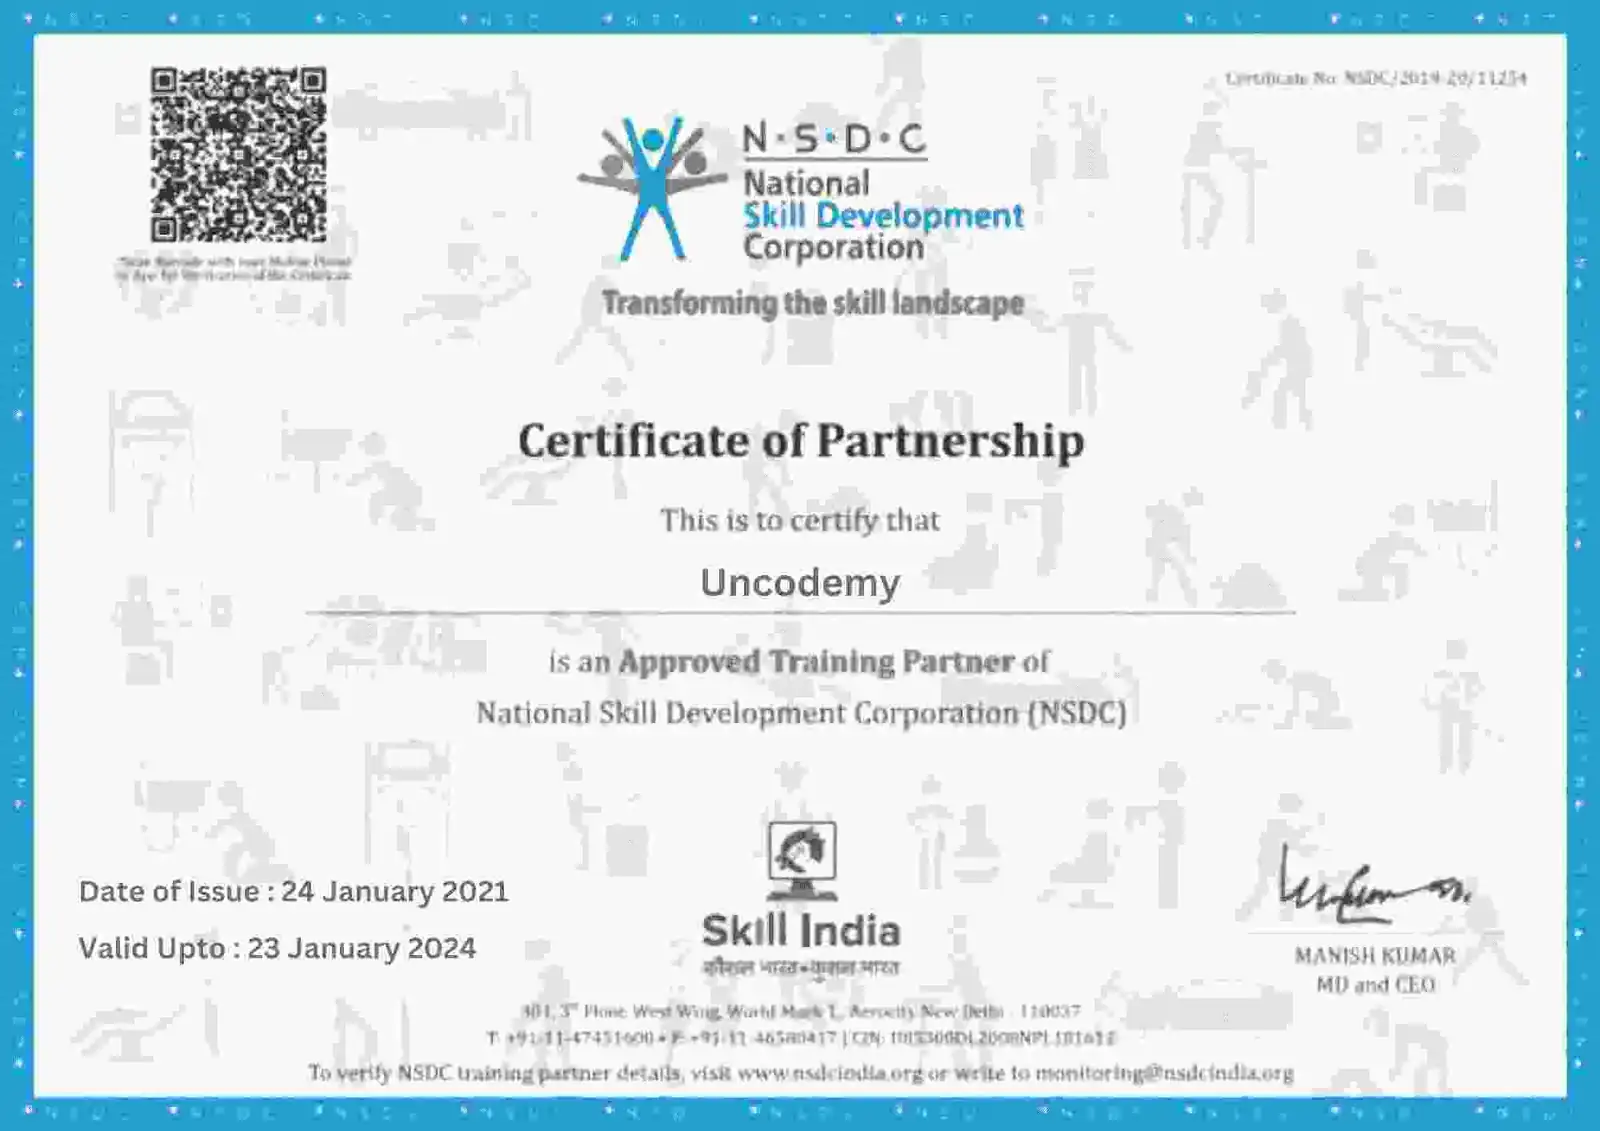

Uncodemy is run by Uncodemy Edutech Pvt. Ltd. Its courses have one goal: getting learners hired. Classroom batches meet in Delhi and Noida; live online batches bring the same teaching to Mathura and the rest of India. Learners include beginners, graduates, freshers and working professionals.
Throughout the course you apply Excel, SQL, Python, statistics, Power BI, Tableau and Gen AI to real datasets through projects. The work matches what analytics teams actually do every day — track key numbers, keep dashboards current, write reports and support decisions — so your first job feels familiar rather than strange. You can read every module of the syllabus before you join.
Classes come with live mentoring, practice tasks, projects, mock interviews and career guidance. The career support policy is shared in writing before you pay. It explains what's included, what isn't and who qualifies.
Prefer a related track? From Mathura or Vrindavan you can enrol in live online AI, ML, Data Science or Business Analysis instead.
Start from Mathura. Join live classes, practise on real data, build a portfolio and get ready for analyst roles in Braj, NCR or remote teams.
Mathura's data jobs come from three directions. Pilgrimage tourism in Mathura, Vrindavan, Govardhan and Barsana keeps hotels, guest houses, travel operators and temple trusts busy with booking, footfall and donation records. The Mathura refinery and the contractors, transporters and service firms around it generate maintenance, safety and logistics data. And Braj's dairy cooperatives, milk processors and famous sweet makers track procurement, production and outlet sales.
Silver-jewellery workshops, textile printing units in the industrial area, banks, hospitals and colleges add more openings, and the Yamuna Expressway puts Noida and Greater Noida within easy reach. Many learners also target NCR and remote roles. Everywhere, SQL and a BI tool are expected. The people who get hired can frame the business question, pick the right number and explain their advice simply.
Course graduates typically apply for Data Analyst, Business Analyst, MIS Executive/Analyst, Business Intelligence Analyst, Marketing/Product Analyst and Operations Analyst posts. The questions change with the employer — a Vrindavan hotel cares about room nights, a milk union about litres collected, a refinery vendor about equipment uptime — but the toolkit stays the same: SQL, Excel and a dashboard.
| Role | Core Tools |
|---|---|
| Data Analyst | SQL, Excel, Python, Power BI |
| Business Analyst | SQL, Excel, BI tools |
| MIS Executive / Analyst | Excel, SQL, Power BI |
| Business Intelligence Analyst | Power BI, Tableau, SQL, DAX |
| Marketing / Product Analyst | SQL, Python, BI tools |
| Operations Analyst | Excel, SQL, Power BI |
Mathura freshers usually start as Data, MIS or Business Analysts. Within two to four years, many move into BI, product, marketing or operations analytics. What gets you there: owning complete analyses and learning your industry's language.
What you earn depends on experience, industry and real skill with SQL and BI, and two people with the same job title can be paid very differently. Profiles that stop at dashboards usually start low. Those who can also write efficient queries, break a messy problem into parts and argue for a clear course of action start higher and get promoted faster.
| Career Level / Role | Indicative Salary Range |
|---|---|
| Entry-Level Data Analyst | ₹3–6 LPA |
| Data Analyst (Mid-Level) | ₹6–10 LPA |
| Senior Data Analyst | ₹10–15 LPA |
| Business Intelligence Analyst | ₹7–12 LPA |
Sources reviewed: AmbitionBox, Glassdoor, Indeed and Uncodemy placement records. Reviewed: 12 October 2026.
Local Mathura businesses usually pay less than NCR firms; remote and Noida roles often sit higher in each band. These are guides only — role, skills, experience, location, employer and market all matter. Uncodemy guarantees no salary or job.
Uncodemy's hiring network has 850+ companies across India, from large firms to start-ups. For Mathura and Braj learners, analyst work is most common in:
Pilgrimage tourism and hospitality — bookings, footfall, pricing and festival-season planning
Refinery and energy services — maintenance, safety, logistics and contractor reporting
Dairy and sweets — milk procurement, production yield and outlet-wise sales
Banking, healthcare and education — collections, patient and admissions dashboards
NCR and remote roles — analytics jobs in Noida, Greater Noida and remote teams
Hotels, dairies and refinery contractors look for different strengths in interviews. Decide early which one you're aiming for, and point your portfolio projects in that direction.
Analyst skills come in a fixed order, and each one leans on the one before. Skip a step and it usually shows up at the worst moment — in a technical interview or during your first month at work — because employers test what you can actually do, not what you've read.
Excel. XLOOKUP, pivots, Power Query. Monthly bookings or outlet sales summarised in minutes.
SQL. Joins, GROUP BY, subqueries, window functions. Almost every interview starts here.
Python. Pandas and NumPy for big files. Scripts that rebuild your weekly report.
Statistics. Sampling, significance tests, regression. So your conclusions hold up.
A dashboard you'd hand to the owner. Pick Power BI (with DAX) or Tableau (with calculated fields) and keep polishing until it runs without you.
Portfolio. Three to five projects — festival occupancy, dairy yield — each ending in a recommendation.
Applications. Timed SQL practice, mock cases, and a CV and LinkedIn that show results.
Most Mathura learners need around six to seven months of steady practice before interviews feel comfortable. An hour a day, kept up through festival seasons and exams, beats a long session once a week.
Analytics courses come at every price, from cheap weekend classes to expensive bootcamps. Here is exactly what Uncodemy's program includes.
| Factor | This Program |
|---|---|
| Duration | 6–7 months |
| Learning hours | 120+ hours |
| Tools covered | 10+ tools |
| Gen AI module | Dedicated 8-hour module |
| Projects | 5 guided + 1 capstone |
| Career support | Resume, LinkedIn, mock interviews, hiring network |
Why six to seven months? Because freshers now get tasks that start in Excel, need SQL halfway through, may need Python to automate and end on a dashboard for the boss. Recorded self-paced courses are cheaper. If you only want to tidy up your Excel and Power BI for a shop or hotel desk, one of those may serve you better.
Same syllabus, trainers, projects and fee in every format. From Mathura, live online is the easy choice: real-time classes from home, doubts solved on the spot, timings around work or college.
Classrooms are only in Noida and Delhi (Shakarpur). The Yamuna Expressway makes Noida reachable, so some Braj learners mix in occasional classroom days. Online learners get the same teaching, recordings, doubt support and placement help, and a permitted switch keeps your progress.
| If you want... | Recommend |
|---|---|
| Only Excel + Power BI basics | A shorter course may be sufficient |
| Full analyst career transition | This program |
| Heavy ML/Data Science | Choose Data Science |
| Business-focused analytics | Consider Business Analytics |
| Self-paced learning | Recorded course |
Faculty behind the Mathura batches. Mathura learners are taught in real time by trainers who also teach in our Delhi and Noida classrooms — same faculty, same syllabus, delivered live online. Senior Trainer Irshad Khan heads the Data Analytics track and signed off its curriculum.
Uncodemy keeps teaching and checking separate: domain reviewer Upendra Kumar Tiwari verifies the content without teaching the batch. In doubt-clearing sessions, trainers often rework examples around refinery and energy services and dairy and sweets — the kind of data employers in Mathura & Braj actually hold.
All trainers and reviewers are published on the Uncodemy trainers page with their domain and experience.

Data Analytics Trainer
Expertise5+ years in logistics and consumer-brand analytics, with a strong focus on time series, NLP and applied automation.
Speech-to-text using core NLP (T2S), talent acquisition research, and product launch & CMS work on keventers.com using Sparktech.
Data Analytics Trainer
ExpertiseTrainer for the analytics and business intelligence track at Uncodemy, working with learners on Excel, SQL and BI tooling from first principles to interview-ready projects.
Guides classroom capstones on sales and customer dashboards, KPI reporting and end-to-end data cleaning workflows.

Data Analytics Trainer
Expertise3+ years building generative AI and machine learning systems, now Senior Gen AI Engineer at Uncodemy, with deep work in RAG, knowledge graphs, data analysis and AWS.
NEMI, an enterprise memory system built on RAG, knowledge graphs and vector databases, plus automated web-scraping bots and generative AI chatbots and predictive analytics for startups.
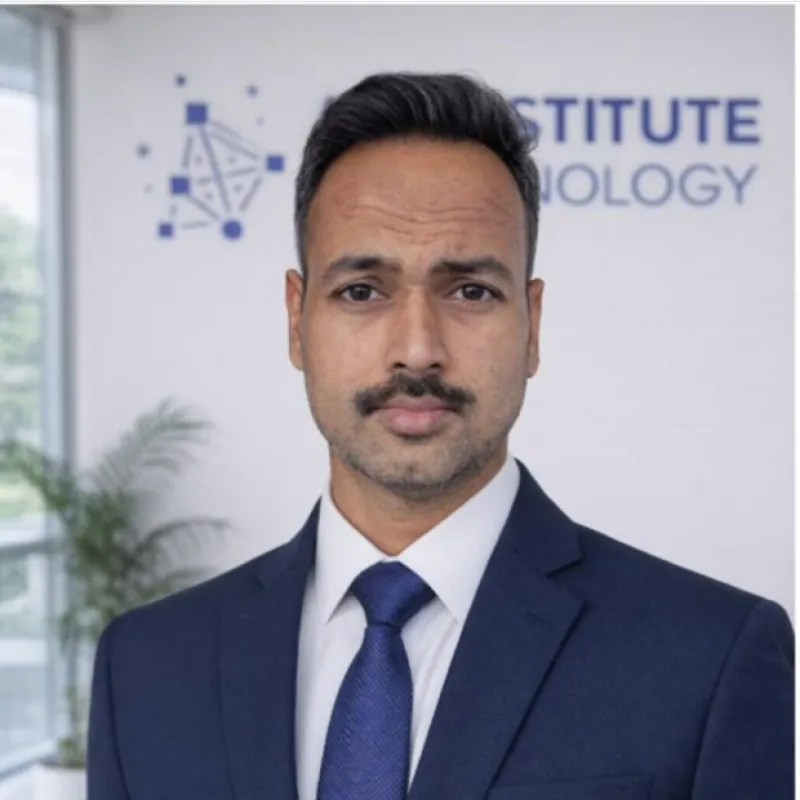
Data Analytics Trainer
Expertise14+ years in banking and insurance operations at Aon Hewitt, NIIT Technologies and Coforge, now teaching Excel, SQL, Python and Power BI through real business scenarios.
MIS reports and Excel dashboards for leadership tracking SLAs, error rates and backlog, SQL data cleaning and validation across systems, and live Power BI dashboards.

Data Analytics Trainer
Expertise5+ years across roles at Concentrix, Amazon and Tech Mahindra. A certified Data Scientist who now teaches data science and analytics as Academic Faculty at Uncodemy.
Credit risk management analytics at Tech Mahindra, business communications analytics, and chatbot solutions built with prompt engineering and machine learning.
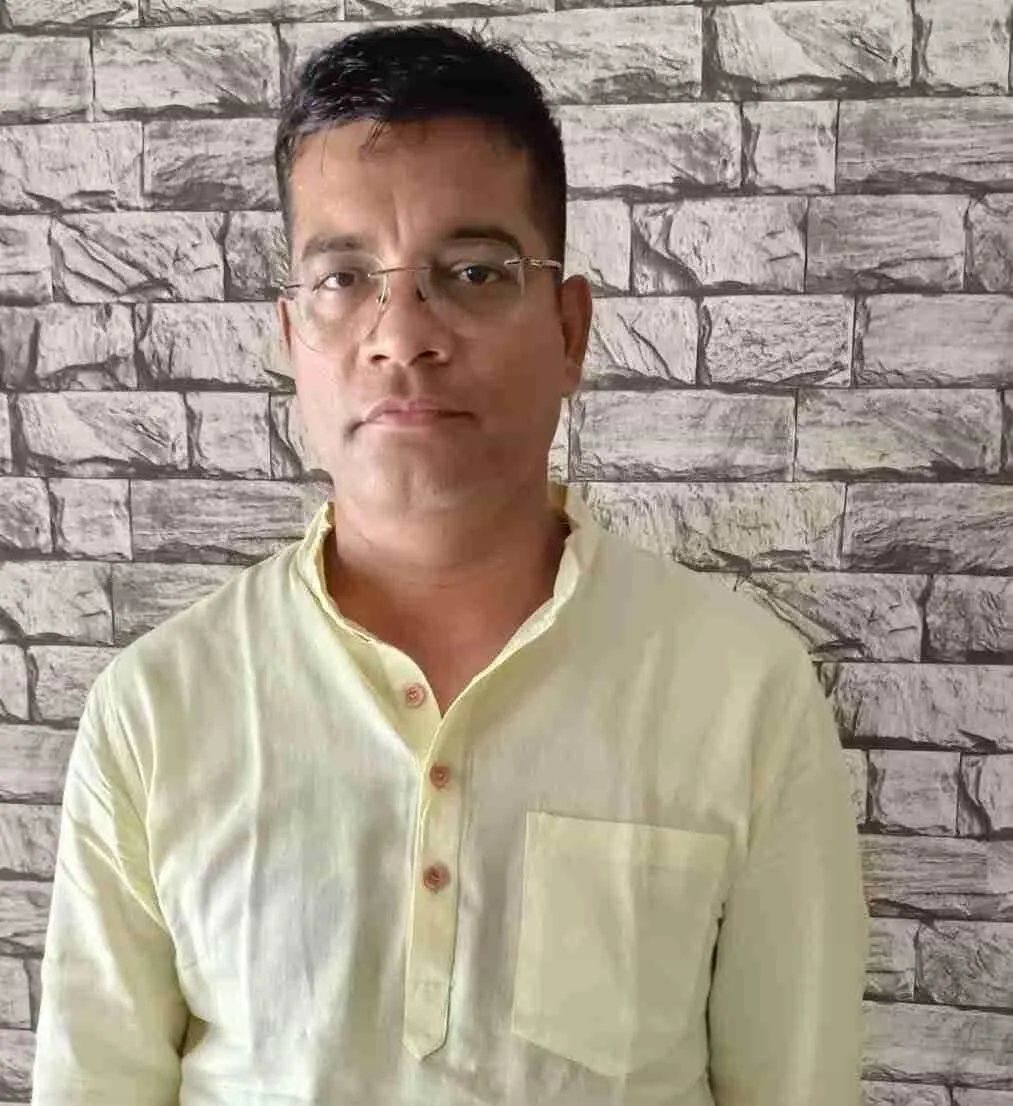
Senior Data Science Trainer
Expertise15+ years of industry experience building production machine learning systems for retail, telecom and consulting teams.
Modelling security breaches in iOS apps, dormant customer prediction and factor analysis, last-mile delivery optimisation, and credit card fraud detection.

Data Analytics & AI Trainer
Expertise8+ years across consulting and public-sector analytics, with deep hands-on work in AI and MLOps delivery.
Built an OCR model, a disease-prediction model, and a fraud-control model deployed across every Indian state under the Ministry of Health & Welfare.

Data Analytics & AI Trainer
Expertise7+ years turning aviation and enterprise data into forecasting models, dashboards and AI assistants.
AI agent chat/voice bot, AI-driven data analysis, a sales-forecasting ML model, NPS data model evaluation, and a face-recognition model for biometrics.

MD & CEO
ExpertiseFounder, MD & CEO of Uncodemy and GS Net Academy, with experience in education, technology leadership, research, mentorship and career development.
Leads strategic direction, academic initiatives, technology-driven education programs and mentorship across Uncodemy and GS Net Academy.
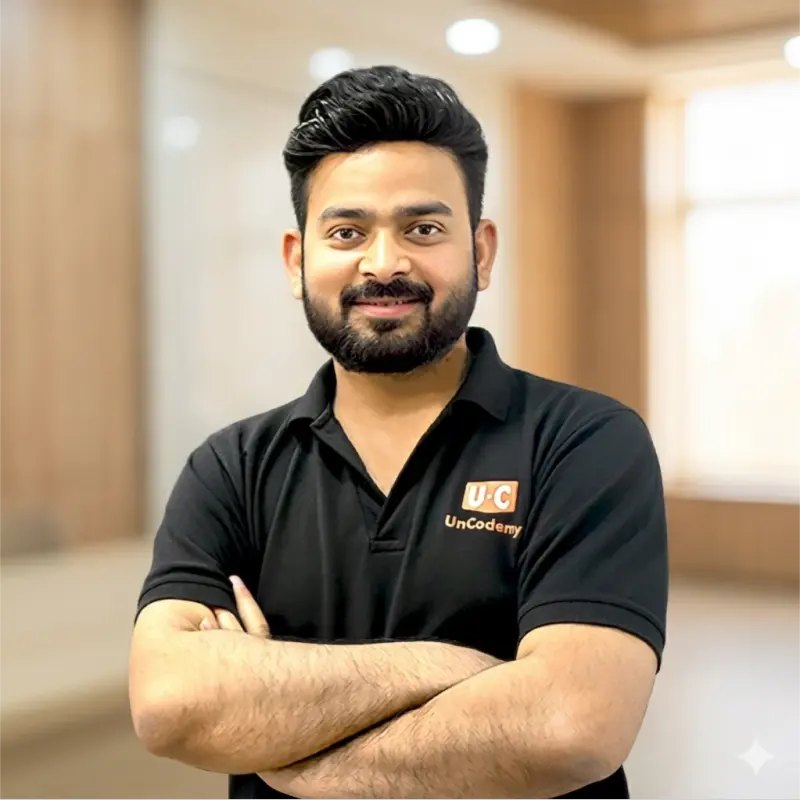
CEO & Founder
ExpertiseCEO & Founder of GvCloud Secure and Uncodemy with 14+ years of professional experience building scalable web, mobile and AI-driven solutions for clients across India, USA, UK, Canada, Australia and Singapore.
Leads technology strategy, scalable web and mobile solutions, AI-driven products and EdTech initiatives across Uncodemy and GvCloud Secure.
Six to seven months. That's 75+ live online classes and 120+ hours. Mathura learners choose weekday or weekend batches.
Yes. Many Braj learners start with zero coding. SQL begins with one SELECT line. Python begins with variables. Months one and two are mostly Excel and SQL.
Ten-plus. Data: SQL, Python, Pandas, NumPy. Reasoning: Statistics. Reports: Excel, Power BI, Tableau. AI: ChatGPT, Copilot.
Yes. Module 8, eight hours: prompts for data tasks, checking AI-written SQL and Python, Copilot in Excel and Power BI, spotting wrong AI numbers.
Six. Five guided (retail, banking, HR, e-commerce, healthcare) plus a capstone you choose. Festival-season hotel data or dairy sales would suit Mathura employers.
Live. All 75+ classes are taught in real time. Recordings follow for revision. One syllabus for every format.
₹20,650 total: ₹17,500 plus 18% GST. Includes classes, materials, projects, certificate and placement help. EMI from ₹4,032 a month.
Yes. EMI starts at ₹4,032 a month. Tenure and approval depend on the financing partner; a counsellor arranges it.
Yes. Book a free live demo from Mathura. Watch a trainer, ask questions, see the syllabus. Call or message us.
We do. The placement team rewrites your CV and LinkedIn, critiques your portfolio, runs mock interviews and forwards vacancies from 850-plus partner employers. The company always makes the final call, so a job can't be promised.
Very much so. Braj hotels, dairy processors, refinery vendors and remote analytics teams take on newcomers who can show SQL, a dashboard tool and finished projects. Opening offers usually land between ₹3 and ₹6 LPA.
Guide figures: freshers ₹3–6 LPA, a few years in ₹6–10 LPA, seniors ₹10–15 LPA. Jobs inside Mathura often pay below Noida or work-from-home roles. Uncodemy commits to no number.
The first rung is usually Data Analyst, MIS Analyst or Business Analyst. Climb further and the paths split — BI engineering, reporting leadership, product or marketing analytics, operations.
Any graduate, any subject. No coding or analytics background needed.
No — think of them as signposts. They come from our placement logs and public review sites, both updated over time. Your result depends on your skills, background, location, the employer and timing; lenders decide on EMIs.
Not in Braj. Uncodemy teaches face to face only in Delhi and Noida. Mathura learners follow identical batches over a live link. Heading to Delhi? The Shakarpur Extension office is a few minutes' walk from Nirman Vihar Metro.
More than 850 recruiters — HSBC, Genpact, Fiserv, upGrad and Clarivate among them. Alumni on file include Business Analysts at Fiserv and HSBC, a Process Developer Analyst at Genpact and an Intellectual Property Analyst at Clarivate.
In analyst hiring, a portfolio says more than a certificate. Below are five learner capstones with their mentors and source code; the Mathura note on each card suggests how to rebuild it around pilgrimage tourism.
 UncodemyDATA ANALYTICS
Clean sales data in SQL Server. Build an interactive Power BI dashboard with a map, monthly trend and product drill-down, each chart tied to a requirement.
Mathura version: Run the same SQL Server + Power BI pipeline on pilgrimage tourism sales from Mathura and compare months, products and outlets.
 Python
 Excel
 Power BI
 SQL
 Ms. Rachna VermaData Analytics Trainer
 Sagar Bajirao ShembadeData AnalystUncodemyDATA ANALYST
Design a PostgreSQL database for an online music store in PgAdmin4. Query it with SQL to find top genres, loyal customers and growth areas.
Mathura version: Model a dairy and sweets catalogue the same way and rank items, customers and areas of Mathura & Braj by revenue.
Power BI DAX
 CSV
 GitHub
 Dr. Vijay K. GuptaMD & CEO
 Ankit SinghData AnalystUncodemyDATA ANALYTICS
Python | Pandas | Jupyter Notebook | GitHub | Mr. Upendra Kumar Tiwari – Senior Data Science Trainer | Shruti Saxena – Data Analyst
Mathura version: Clean and chart public health or footfall data for Mathura & Braj with the same Pandas and Matplotlib workflow.
Python Pandas
 Jupyter NotebookGitHub
 Mr. Upendra Kumar TiwariSenior Data Science Trainer
 Shruti SaxenaData AnalystUncodemyDATA ANALYTICS
Link Python, SQL and Power BI into one report pack on staff, sales and performance for a sample company.
Mathura version: Build a scorecard of refinery and energy services employers around Mathura — size, hiring trend and pay bands — with SQL and DAX.
PythonSQLPower BIDAXMs. Rachna VermaData Analytics Trainer Rajat KashyapData AnalystUncodemyDATA ANALYTICS
Python | Jupyter Notebook | Power BI | SQL | Mr. Upendra Kumar Tiwari – Senior Data Science Trainer | Pawan Mehra – Data Analyst
Mathura version: Swap IPL data for pilgrimage tourism seasonality in Mathura and show peaks, slumps and outliers in one dashboard.
PythonJupyter NotebookPower BISQLMr. Upendra Kumar TiwariSenior Data Science Trainer Pawan MehraData Analyst