


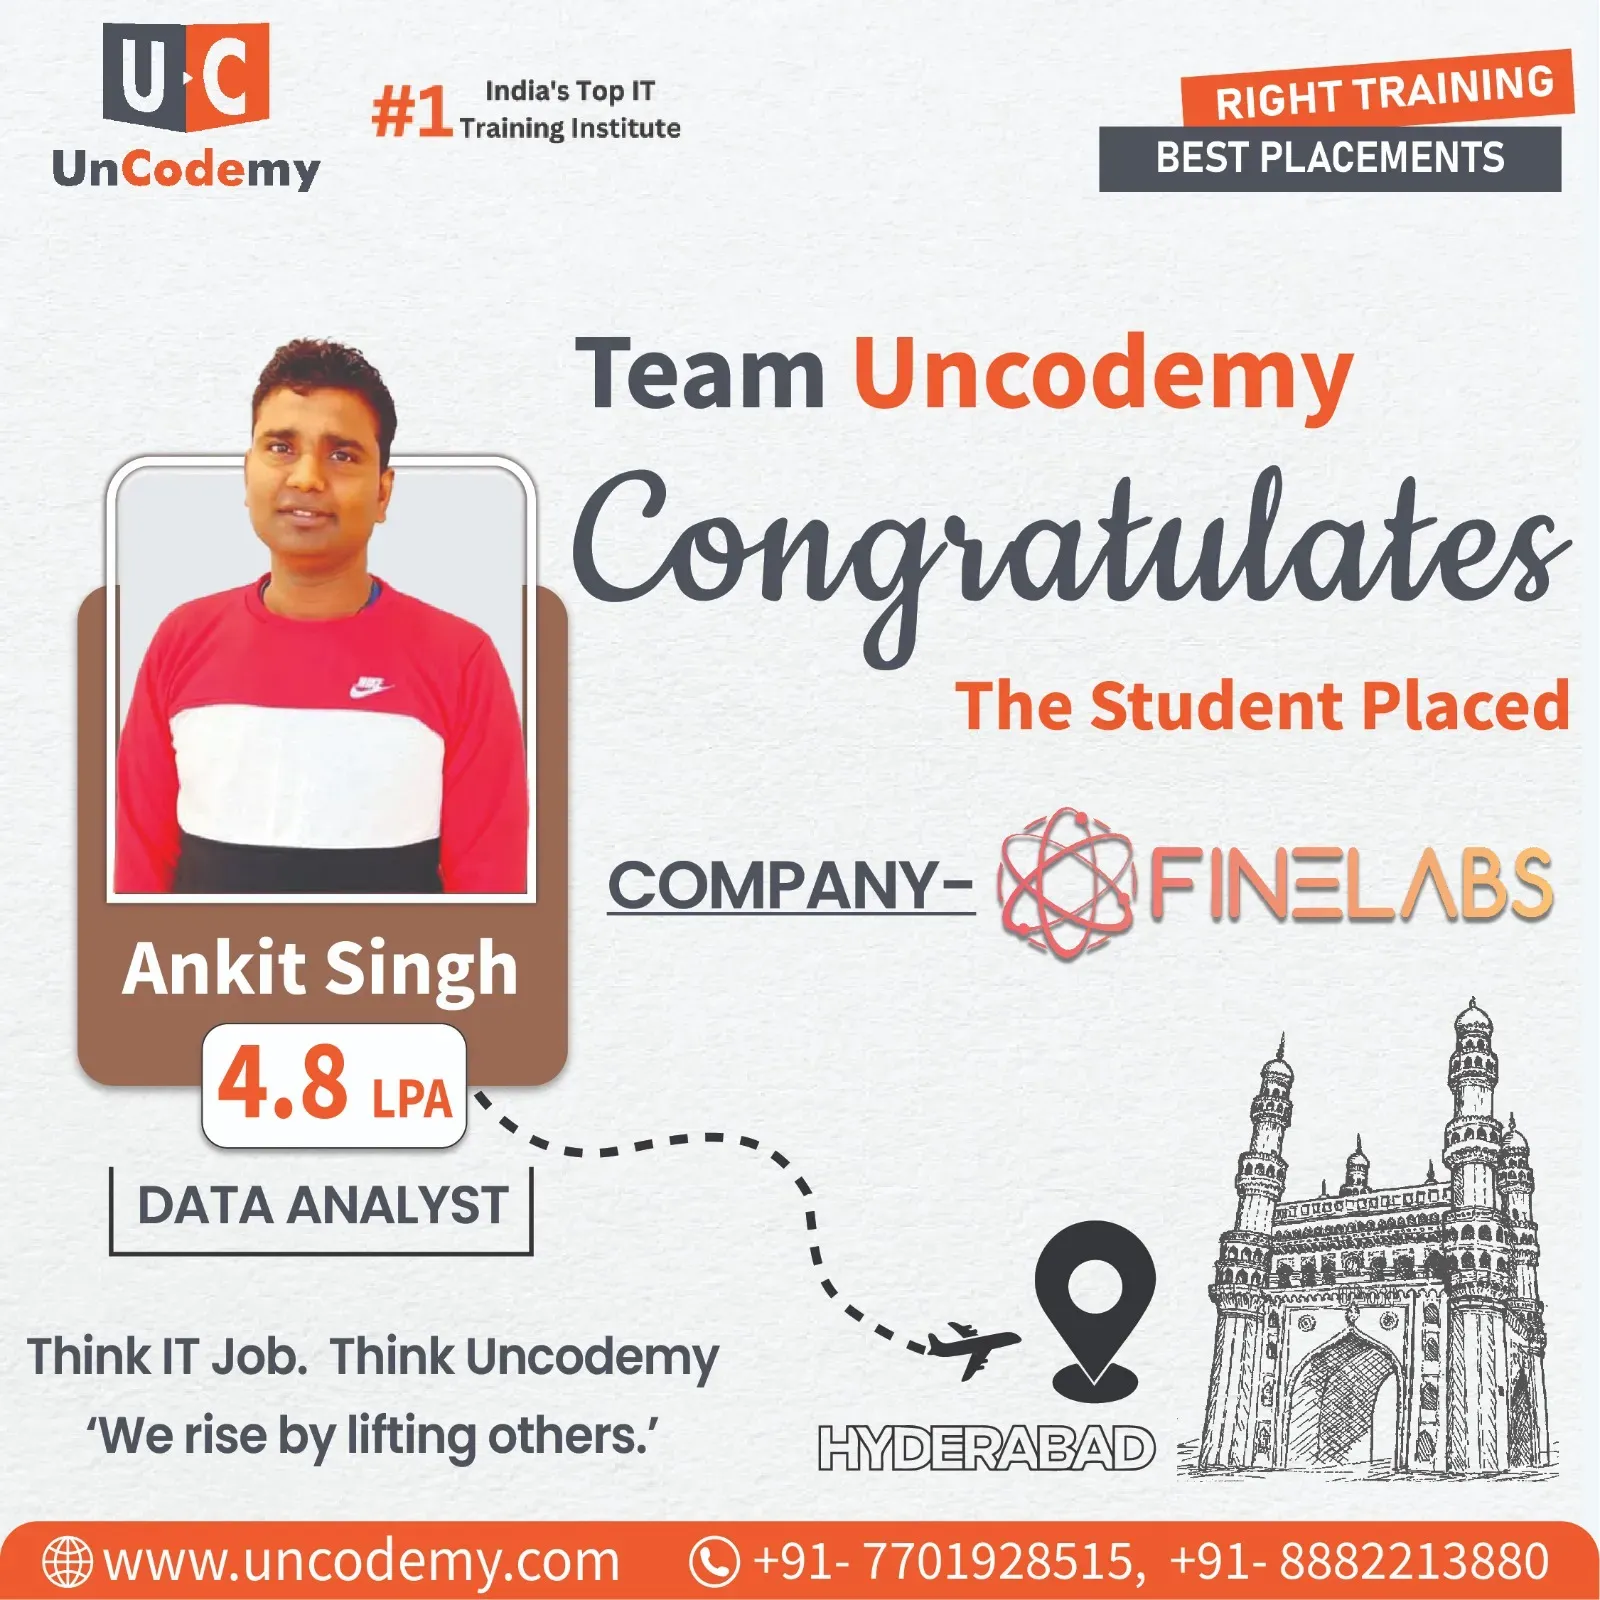
 4.8 LPAHyderabad
Ankit Singh
Data Analyst
- Placed at
- FINELABS
- Program
- Data Analytics Batch
- Batch
- DA/09/0823/S WD 7PM
Choose the best training program according to your career.

Improve the performance of your business with our innovative Industrial Training Program.
Read More →
Our instructor-led training classes are designed to make you an expert.
Read More →
Real-life case studies are a great way to demonstrate your practical knowledge.
Read More →
Explore blogs, latest technologies and industry updates with practical examples.
Read More →
Browse all available training programs and choose the right one for your career.
Read More →Know more about who we are and what we stand for.
Discover our mission to equip individuals with essential IT skills and industry expertise.
Read More →Learn, practice and plan your career — bilkul free.
Book a free video counselling session and pick the right course for you.
Read More →Drive out of Nellore in any direction and you pass shrimp ponds, hatcheries, paddy fields famous for fine rice, and the cranes of Krishnapatnam port on the horizon. Aquaculture exporters, rice millers, power plants and port operators here all deal with numbers that change with the tides and the seasons — stocking density, feed ratios, harvest weights, vessel schedules. Uncodemy's Data Analytics Course helps Nellore learners make sense of those numbers through 6–7 months of live online classes in Excel, SQL, Python, Statistics, Power BI, Tableau and Generative AI.
There is no Uncodemy branch on the Nellore coast. The institute teaches face to face only at Noida and at Delhi's Shakarpur Extension, where its building neighbours DSEU Ambedkar College near Nirman Vihar and Laxmi Nagar Metro Stations. Learners here attend those batches through a live screen and receive more than 120 learning hours, over 75 trainer-led sessions, hands-on projects and a mentor for placement. ₹17,500 is the fee; GST at 18% brings it to ₹20,650.
Nellore learners spend six to seven months in live online classes on Excel, SQL, Python, statistics, Power BI, Tableau and Gen AI, applying them to shrimp-farm, rice-mill, port and hospital datasets, with mentor reviews along the way and interview practice at the end.
On finishing, a Nellore learner can take a pond-wise harvest log, a mill's paddy procurement book or a port's cargo report and deliver a clean, analysed and well-argued result with the most suitable tool. Eligible learners then apply for analyst roles after career prep; several logged outcomes are below.
4.8 LPAHyderabadData Analyst
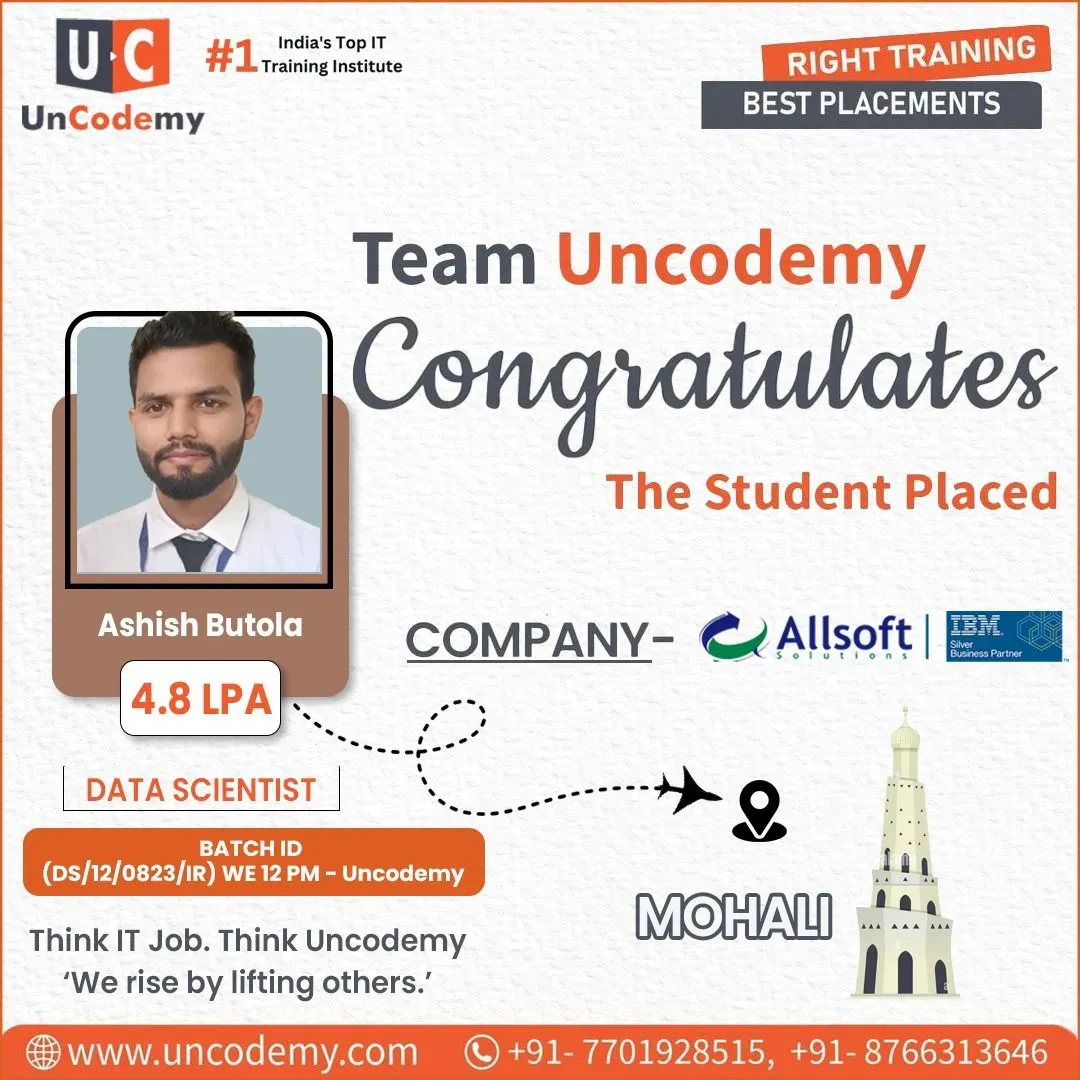 4.8 LPAIndia
Data Analyst
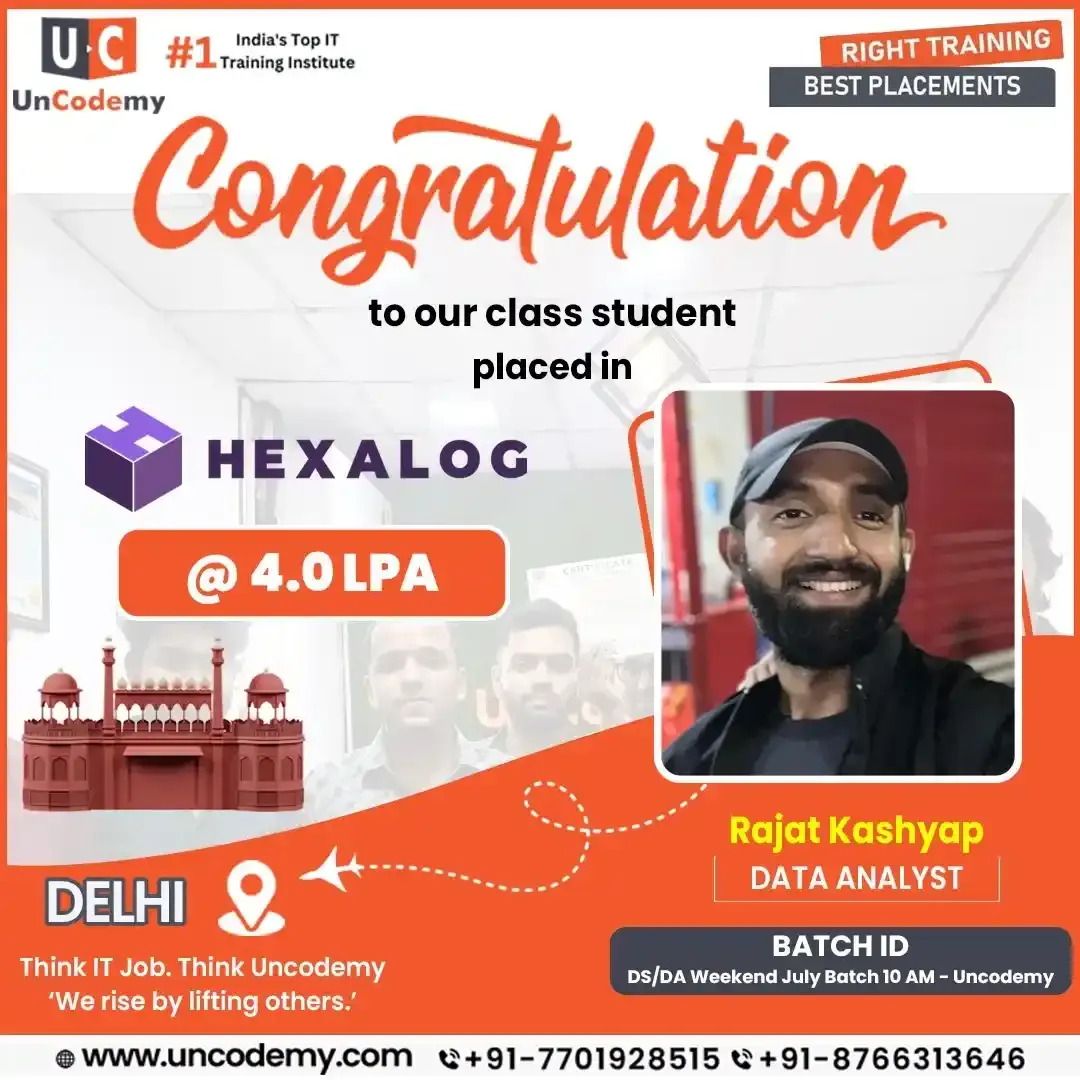 4.0 LPADelhi
Data Analyst
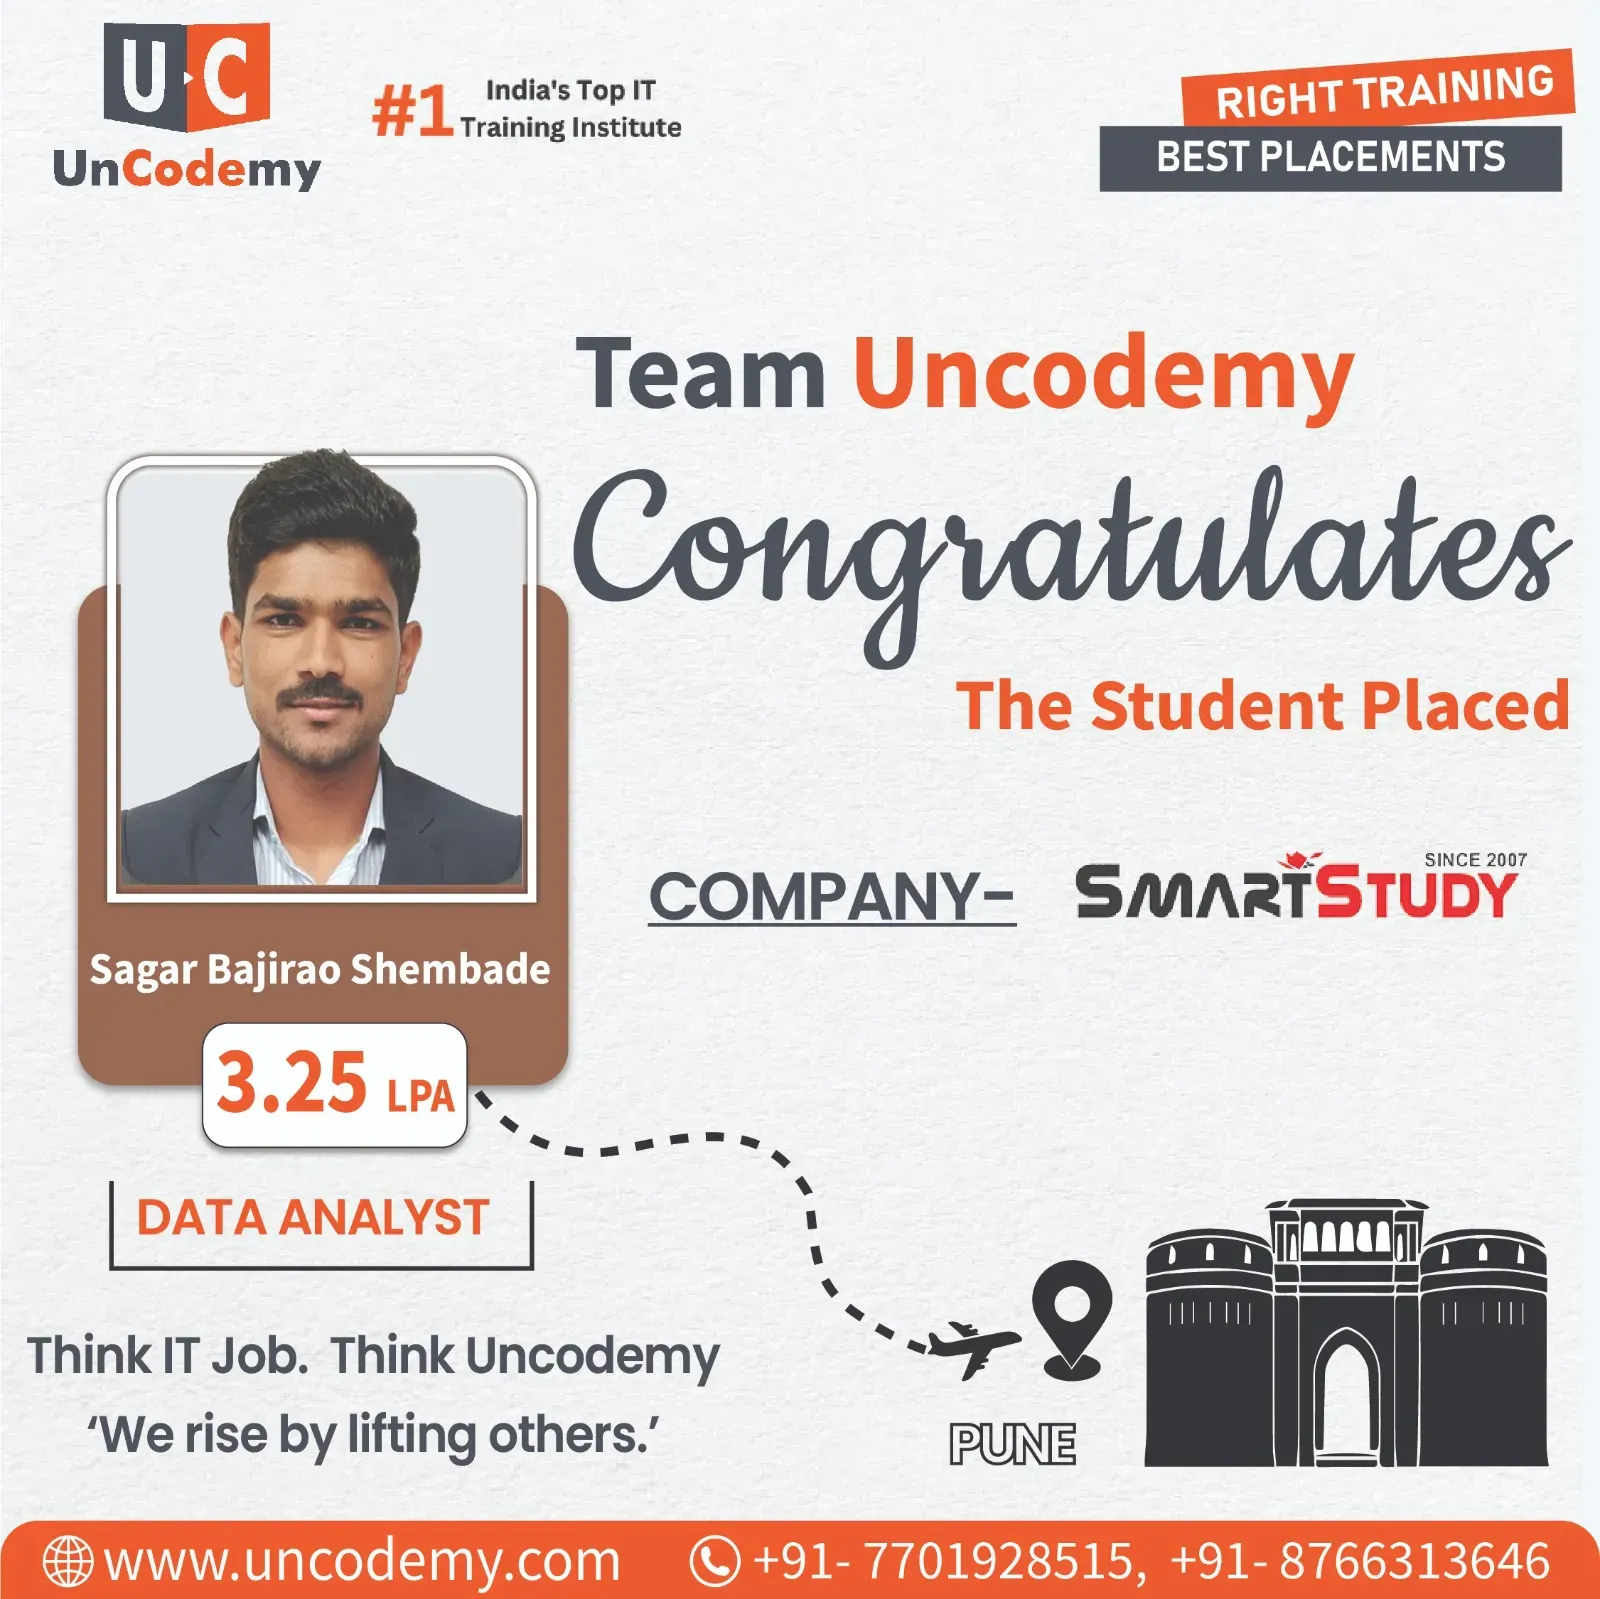 3.25 LPAPune
Data Analyst
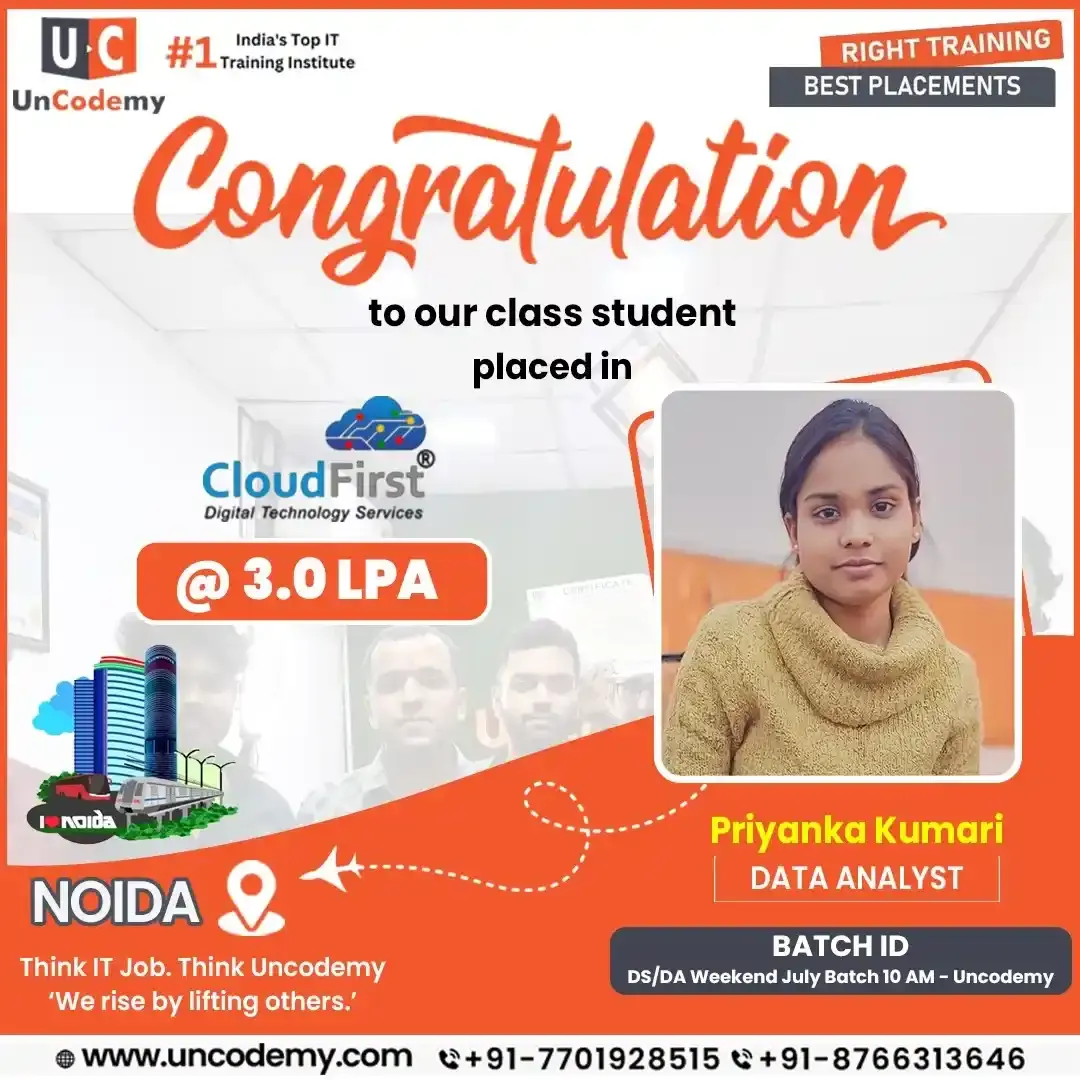 3.0 LPANoida
Data Analyst
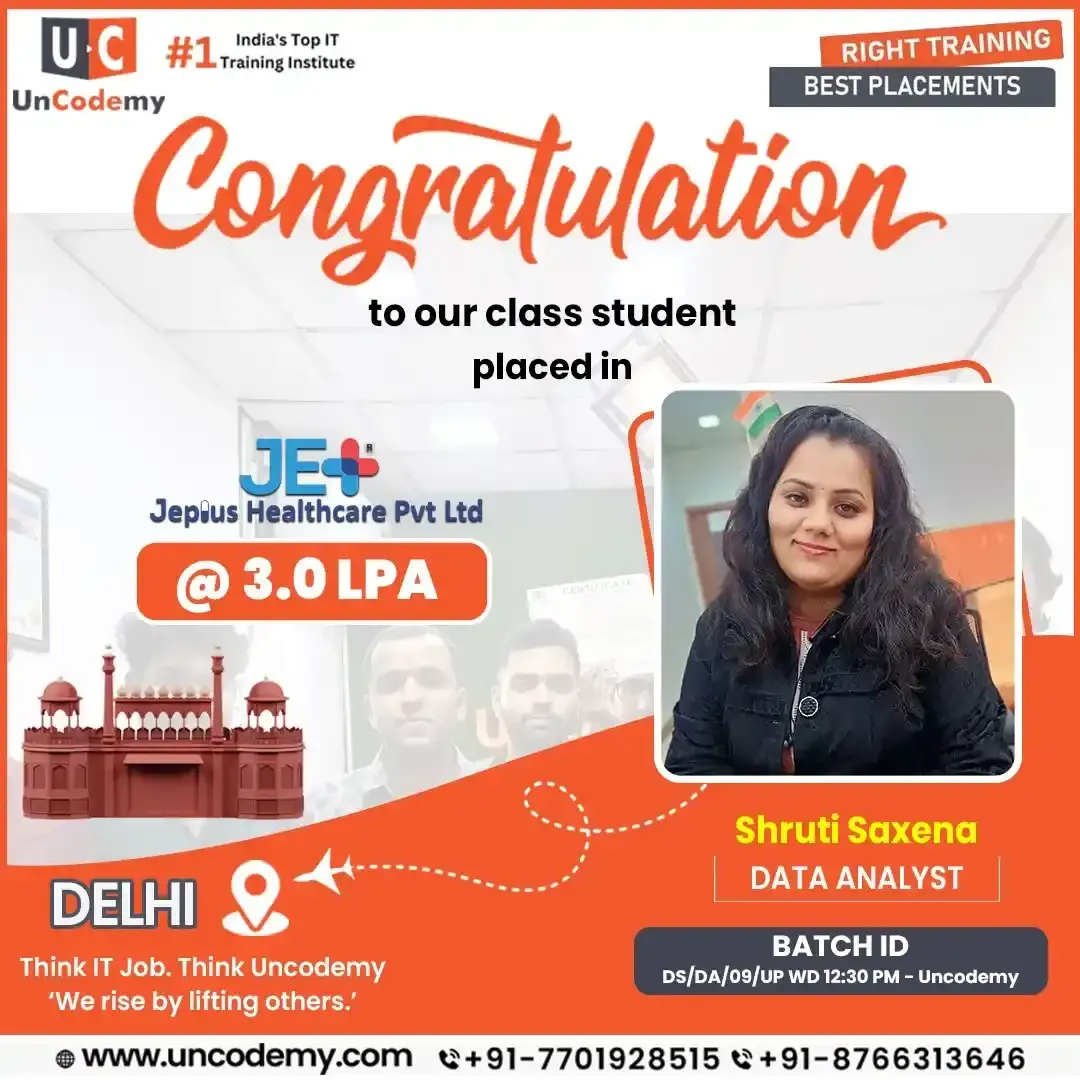 3.0 LPADelhi
Data Analyst
Location badges show where each learner was placed. Nellore learners join these same live online batches and the same career-preparation process; outcomes depend on individual effort and the job market.
A Nellore shrimp farmer feeds ponds daily, checks water quality, watches for disease and decides when to harvest; each choice affects how many tonnes reach the processing plant and at what count size. Data analytics helps by cleaning those daily records, spotting patterns with statistics and charting the results so farmers, feed suppliers and exporters can act early. Rice millers, power companies, hospitals and banks across the district apply the same approach.
In Nellore, an analyst might query farm-management or ERP data with SQL, correct missed entries and inconsistent pond codes, compare ponds, batches or months in Excel or Python, create a Power BI or Tableau dashboard and then sit with an aqua consultant, mill owner, port planner or hospital manager to discuss what to change.
Take a shrimp exporter. Analytics shows why last season's survival rate fell; data science predicts harvest volumes and count sizes for the coming crop; business analytics advises on procurement, processing schedules and buyer allocation.
AspectThese salary bands are indicative first-job ranges taken from the sources noted; actual offers along the coast depend on the employer, the role, your skills and experience, and the time of year.
The Nellore schedule runs 6–7 months, with 75-plus live lectures and over 120 hours of learning. Spreadsheets and SQL open the course; Python, statistics, data cleaning and exploratory work form its middle; Power BI, Tableau and Generative AI close it. Pond, mill and port data appear throughout, a guided build rounds off each phase, and your capstone becomes the centrepiece you present to recruiters.
Eligibility: You need a bachelor's degree in any subject (details on the eligibility criteria page). We begin SQL and Python at the absolute basics, so no coding experience is required. Some comfort with numbers helps, and the statistics module rebuilds key ideas. A laptop with 8GB RAM and a reliable internet connection is recommended.
Live batches run on weekdays and at weekends, timed around college schedules, pond feeding rounds and mill shifts. A free online demo is open to anyone who wants to try a class first.
Seats are limited and updated daily. All timings are in IST.
The 120-plus hours unfold across nine modules that track a real brief from start to finish — gathering records, correcting them, analysing them, interpreting results, charting them and reporting to whoever asked. Each module closes with a scored practical on authentic data, and module nine gathers your best work into a portfolio.
| Module | Topic | Hours | Tools |
|---|---|---|---|
| 1 | Excel for Data Analytics | 12 | Excel, Power Query |
| 2 | SQL & Database Management | 18 | MySQL |
| 3 | Python for Data Analytics | 20 | Python, Pandas, NumPy |
| 4 | Statistics & Business Mathematics | 12 | Excel, Python |
| 5 | Data Cleaning & EDA | 12 | Python, Pandas |
| 6 | Power BI | 18 | Power BI Desktop |
| 7 | Tableau | 10 | Tableau Public |
| 8 | AI & Gen AI for Analysts | 8 | ChatGPT, Copilot |
| 9 | Capstone & Career Prep | 10 | All tools |
| Total | 120 Hours | 10+ tools |
Irshad Khan — Senior Trainer, 8+ Years Experience. Specialization: Data Science, Data Analytics, Business Analyst, SQL, Power BI, Python, Generative AI, Agentic AI.
When the ninth module, every assignment and the capstone are complete, Uncodemy issues the Data Analytics Program Certificate to Nellore learners, recording the course title, its length, the tools mastered, the finish date and a code for verification.
Recruiters want to see evidence of skill, so your certificate is backed by a set of graded spreadsheet, SQL, Python, statistics, BI and Gen AI assignments and a capstone project you planned and completed yourself.
A recruiter in Nellore, Chennai or anywhere else can confirm a learner's credential through Uncodemy's online portal in a few seconds.
Uncodemy Certificate Verification — Online Certificate Verification & Download: certificate.uncodemy.com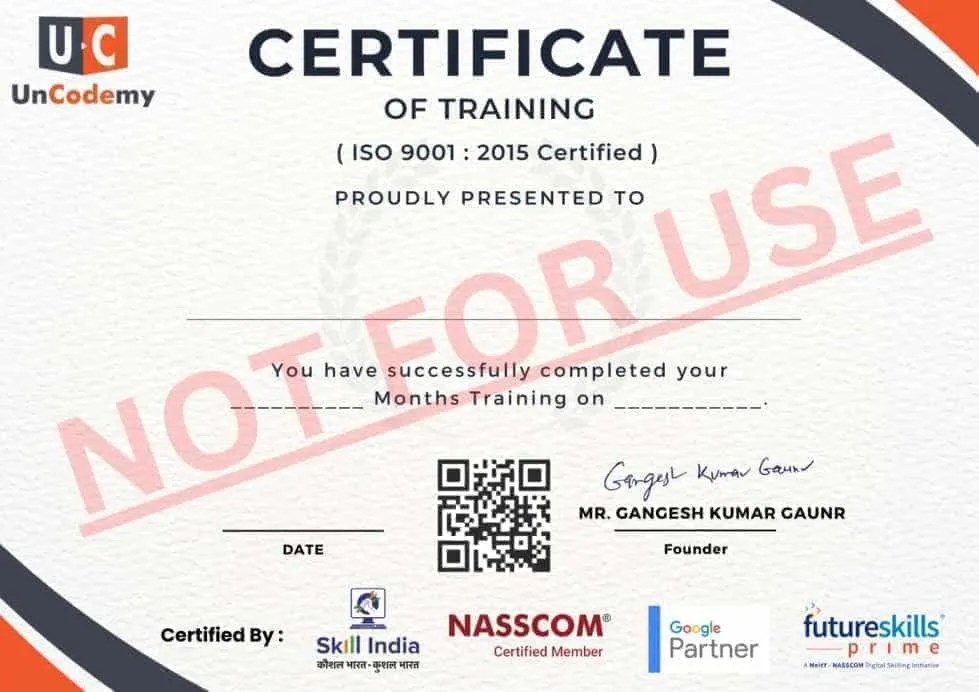
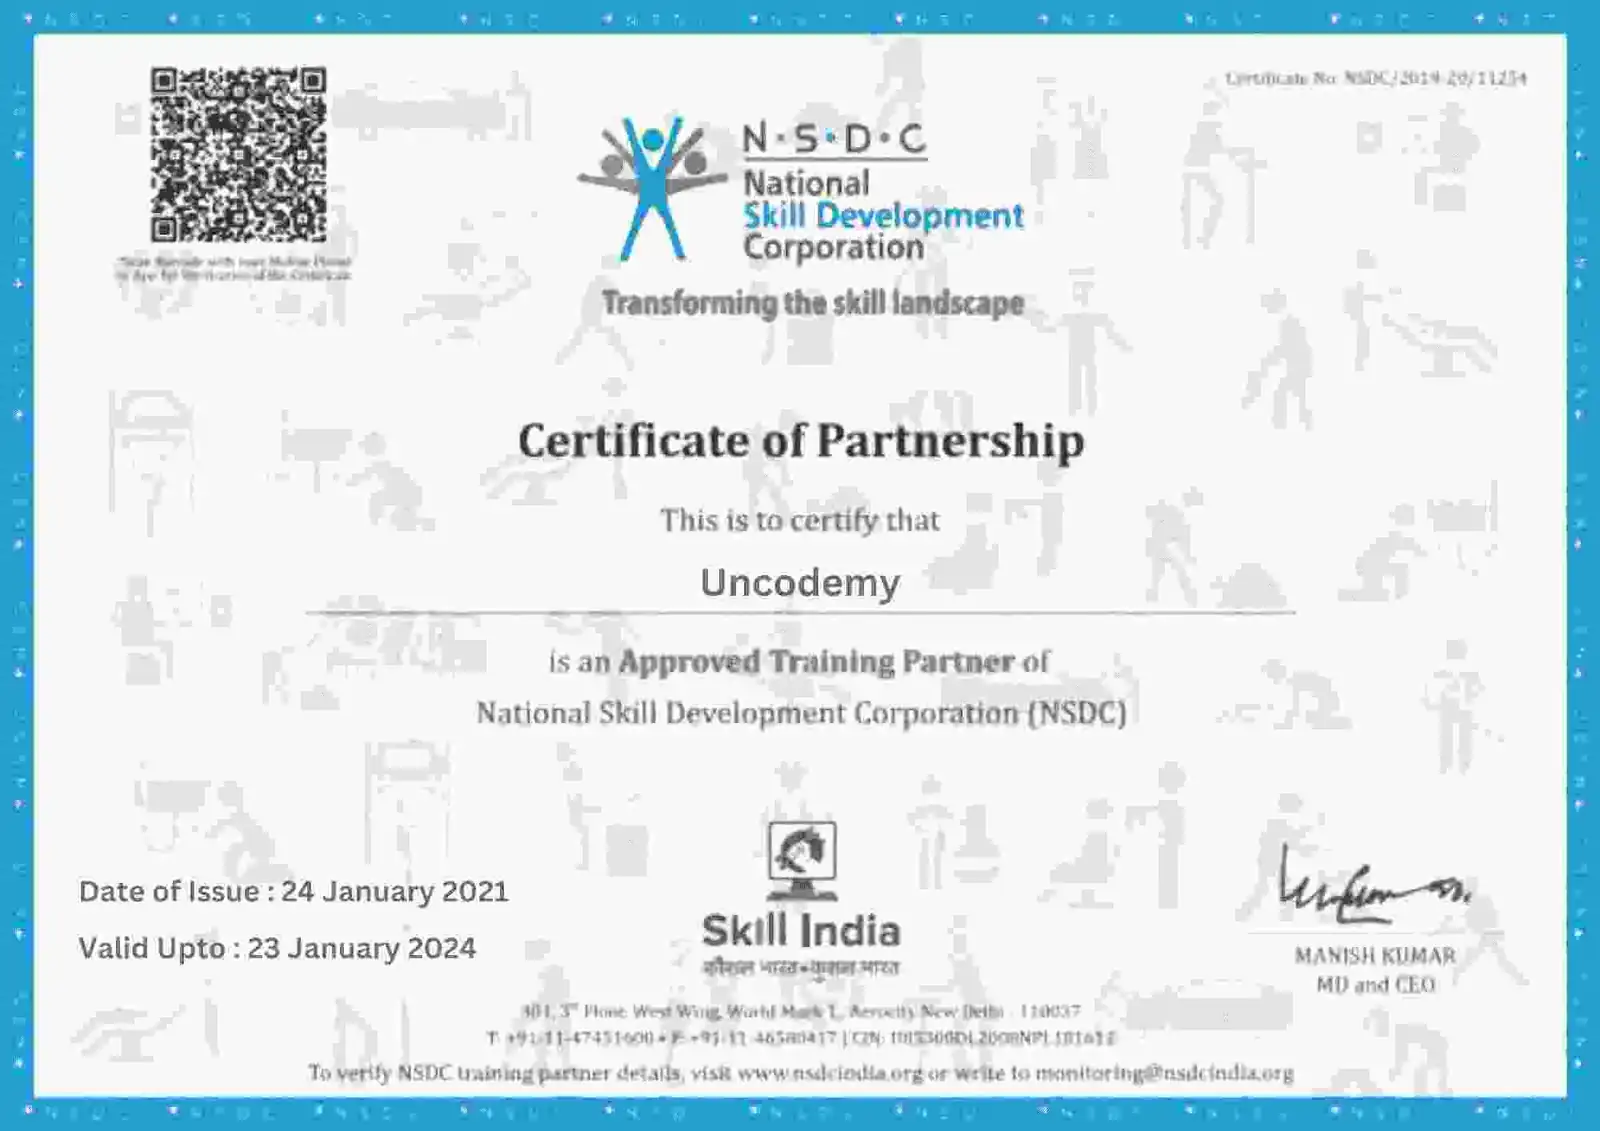
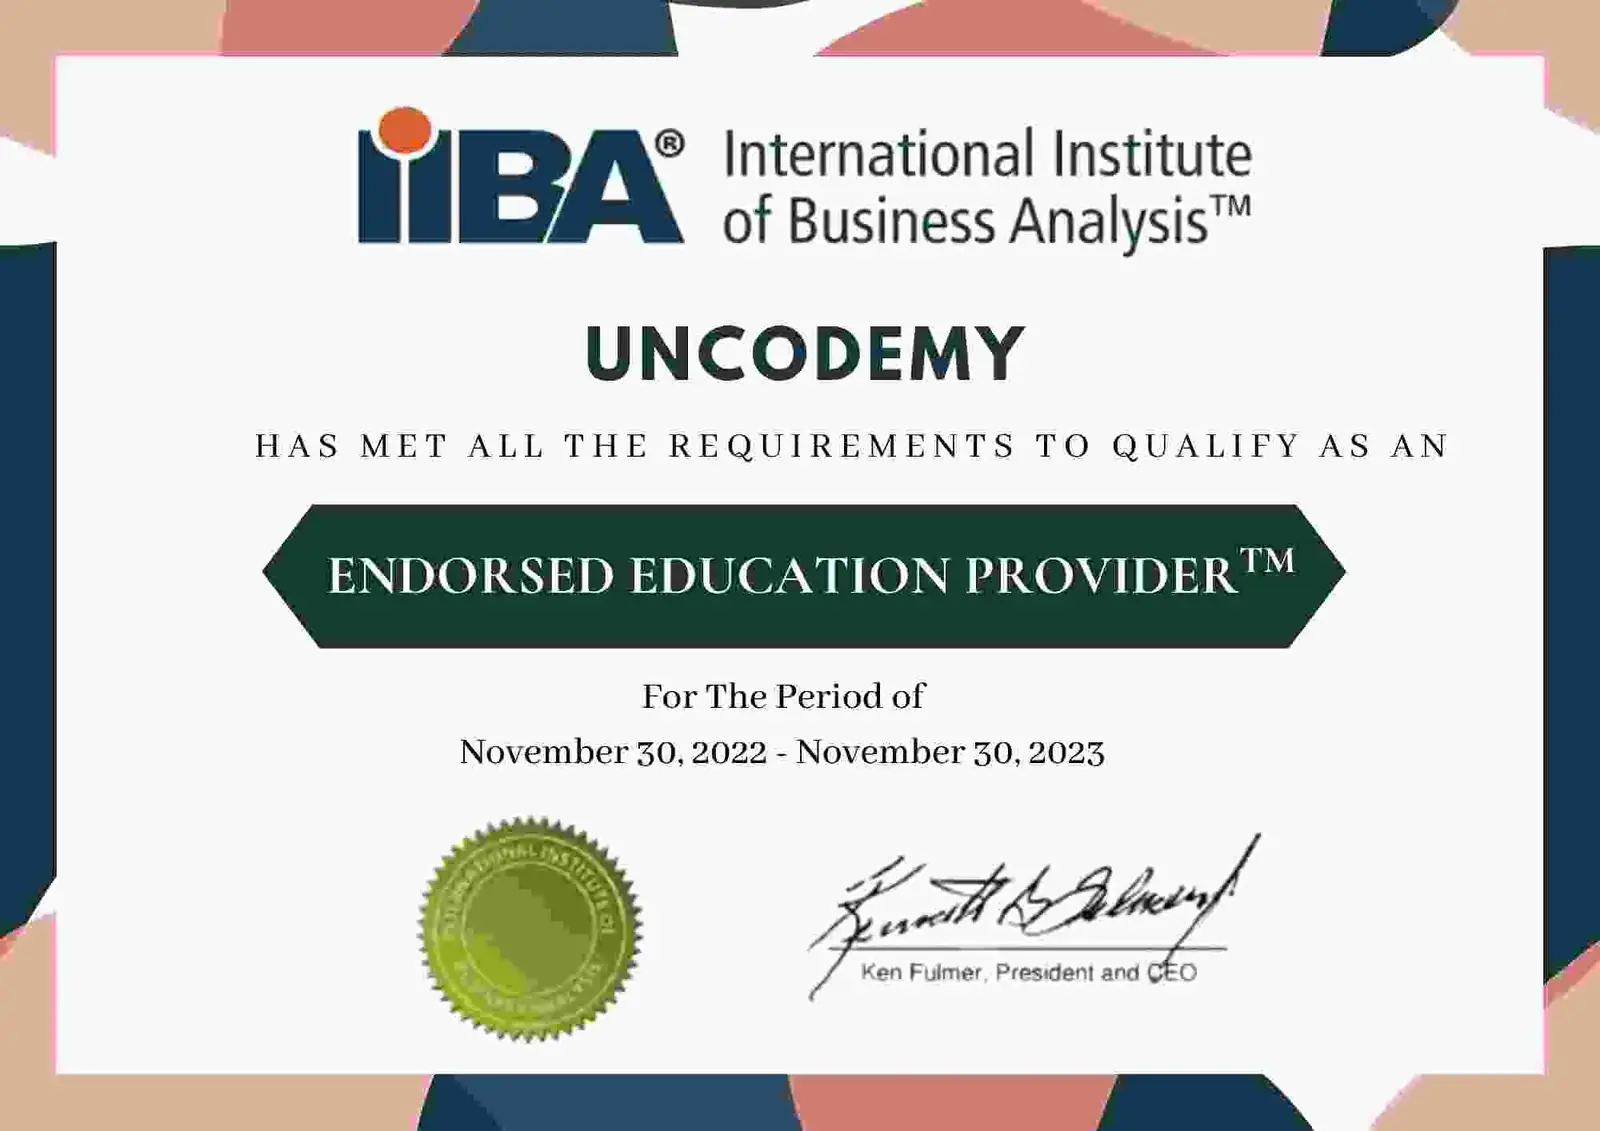
Uncodemy is run by Uncodemy Edutech Pvt. Ltd., with every course designed around helping learners find work. It teaches classroom batches in Delhi and Noida and live online batches for Nellore and the rest of India. Learners include beginners, graduates, freshers and working professionals.
Over the months, spreadsheets, SQL, Python, statistics, Power BI, Tableau and Gen AI are applied to genuine datasets as projects — the same tasks an analyst performs at a shrimp processor's planning desk, a rice mill's procurement office, a port's operations room or a hospital's records section. The module list is published before you enrol.
Along with the live classes, you get mentor support, graded practice work, project reviews, mock interviews and job alerts. We give you the career support policy in writing before you pay, so it's clear what help is included, what isn't and who can use it.
If you're more interested in AI, Machine Learning, Data Science or Business Analysis, you can join those as live online courses with Uncodemy from Nellore.
Start your analytics career from Nellore: join the live online classes, work with aquaculture, rice and port datasets, put together a strong portfolio and get ready for analyst jobs on the coast, in Chennai, in Hyderabad or with remote teams.
Nellore is one of India's leading aquaculture districts. Shrimp farms, hatcheries, feed manufacturers, processing plants and exporters track stocking, feed conversion, water quality, harvest weights and shipments — data that directly affects profit and export quality. The district's paddy and rice-milling industry, known for fine varieties, adds procurement, milling-yield and sales data.
Krishnapatnam port handles coal, containers and agricultural cargo; thermal power plants and industrial units nearby run large operations; and Sriharikota's space centre lies a short drive away, supporting a network of service companies. Hospitals and medical colleges, Vikrama Simhapuri University, banks and cooperatives create further reporting work.
Chennai is about three hours south and Hyderabad is well connected, while remote analytics roles are increasingly common. Throughout, SQL and a BI tool are expected; recruiters choose candidates who can frame the business question, pick the right measure and explain the recommendation clearly.
After the course, Nellore learners usually look for Data Analyst, Business Analyst, MIS Executive/Analyst, Business Intelligence Analyst, Marketing/Product Analyst and Operations Analyst jobs. Whether it's an exporter tracking count sizes, a mill watching outturn or a port measuring vessel delays, the work is done with SQL, spreadsheets and a dashboard.
| Role | Core Tools |
|---|---|
| Data Analyst | SQL, Excel, Python, Power BI |
| Business Analyst | SQL, Excel, BI tools |
| MIS Executive / Analyst | Excel, SQL, Power BI |
| Business Intelligence Analyst | Power BI, Tableau, SQL, DAX |
| Marketing / Product Analyst | SQL, Python, BI tools |
| Operations Analyst | Excel, SQL, Power BI |
Most Nellore freshers begin as Data, MIS or Business Analysts — often at an exporter, mill or port service company — and after two to four years specialise in supply-chain, production, BI or operations analytics, advanced by the complete pieces of work they delivered.
Analyst pay around Nellore moves with experience, sector and real depth in SQL and BI, and the spread inside a single title can be wide. If your skills stop at charts, expect a lower start; add efficient queries, clear problem framing and a confident recommendation, and you'll start higher and climb faster.
| Career Level / Role | Indicative Salary Range |
|---|---|
| Entry-Level Data Analyst | ₹3–6 LPA |
| Data Analyst (Mid-Level) | ₹6–10 LPA |
| Senior Data Analyst | ₹10–15 LPA |
| Business Intelligence Analyst | ₹7–12 LPA |
Sources reviewed: AmbitionBox, Glassdoor, Indeed and Uncodemy placement records. Reviewed: 12 October 2026.
Farms and mills in the district often open below Chennai or Hyderabad packages, while large exporters, port operators and work-from-home employers can reach higher within each bracket. Treat these figures as indicative — they move with role, ability, experience, city, employer and season — and note that no salary or placement is assured.
Uncodemy's hiring network covers more than 850 companies across India. For Nellore learners, analyst work is found mainly in:
Aquaculture — stocking, feed conversion, water quality, harvest and export analytics
Rice milling and agri-trade — paddy procurement, milling yield and sales reporting
Ports, power and industry — cargo, turnaround, energy and maintenance dashboards
Healthcare, education and banking — patient-flow, admissions and credit analysis
Chennai and Hyderabad offices or work-from-home teams — analytics openings outside the district
An aqua exporter, a rice mill and a port operator each test different strengths, so decide which you're aiming for and shape your portfolio projects to match.
Analytics skill builds like a shrimp crop — stage by stage, from seed to harvest. Skip a stage and the yield suffers, usually in a technical interview or your first months on the job.
Seed stage, Excel — practise XLOOKUP, pivot tables and Power Query until a pond-wise feed summary or a variety-wise paddy report takes minutes.
Nursery stage, SQL — joins between ponds, feed and harvests, grouped totals, subqueries and window functions.
Grow-out, Python — Pandas and NumPy for daily farm logs and automated reports.
Water-quality checks, statistics — learn distributions, sampling error, significance tests and regression so a farm consultant trusts that a survival-rate change is genuine.
Harvest, one BI tool — Power BI with DAX or Tableau with calculated fields, polished until an aqua consultant can read pond trends on a phone at the farm gate.
Processing, a portfolio — three to five projects, perhaps feed-conversion drivers, rice outturn by variety or vessel waiting times, each closing with a recommendation.
Export, the job hunt — time your SQL practice, explain mock business cases out loud and update your CV so each project shows a clear before-and-after result.
Most Nellore learners need six to seven months of steady practice — roughly the length of one shrimp crop — to become interview-ready.
Nellore learners can find many analytics courses at very different prices, often based in Chennai or Hyderabad. Here is exactly what Uncodemy's program includes.
| Factor | This Program |
|---|---|
| Duration | 6–7 months |
| Learning hours | 120+ hours |
| Tools covered | 10+ tools |
| Gen AI module | Dedicated 8-hour module |
| Projects | 5 guided + 1 capstone |
| Career support | Resume, LinkedIn, mock interviews, hiring network |
The course takes six to seven months and covers more than ten tools because a junior analyst today is often asked to clean data in Excel, pull it with SQL, automate part of the job in Python and present it on a dashboard. If you only need a quick Excel and Power BI refresher, a cheaper recorded course might be enough.
Syllabus, trainers, projects and fee are the same in every format. From Nellore, live online classes are the practical choice — real-time teaching at home, quick doubt-clearing and timings around college, farm work or plant shifts.
Since Uncodemy's only classrooms are in Noida and at Shakarpur in Delhi — about 1,800 km away — hybrid attendance isn't practical for Nellore. Remote study carries the same entitlements: live instruction, recordings, doubt clinics and the complete placement programme, with progress kept intact if a permitted format change is made.
| If you want... | Recommend |
|---|---|
| Only Excel + Power BI basics | A shorter course may be sufficient |
| Full analyst career transition | This program |
| Heavy ML/Data Science | Choose Data Science |
| Business-focused analytics | Consider Business Analytics |
| Self-paced learning | Recorded course |
Who you will learn from in Nellore. Live sessions for Nellore are delivered online by the Delhi–Noida faculty. Irshad Khan, Senior Trainer for Data Analytics, leads the batch and approved the syllabus on this page, while Upendra Kumar Tiwari reviews its technical accuracy as a separate domain reviewer.
Learners from Nellore & the Andhra coast often work with aquaculture, Krishnapatnam port logistics and rice and agri-trade records, so mentors encourage projects drawn from those sectors — sales registers, stock sheets, booking logs — giving your portfolio something local employers recognise, alongside NCR and remote teams.
Names, domains and LinkedIn profiles of every trainer are public on the Uncodemy trainers page.
Senior Data Science Trainer
Expertise15+ years of industry experience building production machine learning systems for retail, telecom and consulting teams.
Modelling security breaches in iOS apps, dormant customer prediction and factor analysis, last-mile delivery optimisation, and credit card fraud detection.
Data Analytics & AI Trainer
Expertise8+ years across consulting and public-sector analytics, with deep hands-on work in AI and MLOps delivery.
Built an OCR model, a disease-prediction model, and a fraud-control model deployed across every Indian state under the Ministry of Health & Welfare.

Data Analytics & AI Trainer
Expertise7+ years turning aviation and enterprise data into forecasting models, dashboards and AI assistants.
AI agent chat/voice bot, AI-driven data analysis, a sales-forecasting ML model, NPS data model evaluation, and a face-recognition model for biometrics.

Data Analytics Trainer
Expertise5+ years in logistics and consumer-brand analytics, with a strong focus on time series, NLP and applied automation.
Speech-to-text using core NLP (T2S), talent acquisition research, and product launch & CMS work on keventers.com using Sparktech.
Data Analytics Trainer
ExpertiseTrainer for the analytics and business intelligence track at Uncodemy, working with learners on Excel, SQL and BI tooling from first principles to interview-ready projects.
Guides classroom capstones on sales and customer dashboards, KPI reporting and end-to-end data cleaning workflows.

Data Analytics Trainer
Expertise3+ years building generative AI and machine learning systems, now Senior Gen AI Engineer at Uncodemy, with deep work in RAG, knowledge graphs, data analysis and AWS.
NEMI, an enterprise memory system built on RAG, knowledge graphs and vector databases, plus automated web-scraping bots and generative AI chatbots and predictive analytics for startups.
Data Analytics Trainer
Expertise14+ years in banking and insurance operations at Aon Hewitt, NIIT Technologies and Coforge, now teaching Excel, SQL, Python and Power BI through real business scenarios.
MIS reports and Excel dashboards for leadership tracking SLAs, error rates and backlog, SQL data cleaning and validation across systems, and live Power BI dashboards.
Data Analytics Trainer
Expertise5+ years across roles at Concentrix, Amazon and Tech Mahindra. A certified Data Scientist who now teaches data science and analytics as Academic Faculty at Uncodemy.
Credit risk management analytics at Tech Mahindra, business communications analytics, and chatbot solutions built with prompt engineering and machine learning.

MD & CEO
ExpertiseFounder, MD & CEO of Uncodemy and GS Net Academy, with experience in education, technology leadership, research, mentorship and career development.
Leads strategic direction, academic initiatives, technology-driven education programs and mentorship across Uncodemy and GS Net Academy.
CEO & Founder
ExpertiseCEO & Founder of GvCloud Secure and Uncodemy with 14+ years of professional experience building scalable web, mobile and AI-driven solutions for clients across India, USA, UK, Canada, Australia and Singapore.
Leads technology strategy, scalable web and mobile solutions, AI-driven products and EdTech initiatives across Uncodemy and GvCloud Secure.
Plan on six to seven months, about the length of one shrimp crop. You'll attend more than 75 live online classes, totalling over 120 hours, in a weekday or weekend batch that leaves room for pond work, plant shifts or college.
That's the norm here, not a hurdle. Plenty of Nellore learners hold B.Sc aquaculture, B.Com or BA degrees and have never coded; the SQL track begins with a single SELECT, Python with a variable, and Excel plus SQL fill the first couple of months.
Think of it as a well-stocked feed store of ten-plus tools: SQL, Pandas, NumPy and core Python for handling data; Statistics for reading it; Power BI, Tableau and Excel for showing it; and Copilot plus ChatGPT for the repetitive chores.
Module 8 devotes eight hours to Gen AI. You'll learn to brief an assistant on a farm or port dataset, check whether the SQL or Python it hands back is sound, use Copilot inside Excel and Power BI, and discard numbers that don't survive a sanity check.
Six pieces in all: guided builds on retail, banking, HR, e-commerce and hospital data, and one capstone of your own. Pond survival rates or rice-mill outturn would make a memorable Nellore capstone.
Classes happen live, every one of the 75-plus; your trainer answers questions in real time and the recording is posted later. One syllabus serves remote, classroom and hybrid learners alike.
Learners on the Nellore coast pay a single figure, ₹20,650 — the ₹17,500 course fee with 18% GST added. Notes, project feedback, certification and placement help cost nothing extra, and an EMI plan can begin at ₹4,032 a month.
EMI options open at ₹4,032 per month; tenure, final amount and approval are fixed with the finance partner, and your counsellor handles the steps.
Yes — reserve a free trial class from Nellore, watch a trainer teach live, ask your questions and skim the module plan before committing.
Our placement team refreshes your CV and LinkedIn, critiques your portfolio, runs mock interviews and passes on openings from 850-plus recruiters. Because each employer makes its own hiring decision, nobody can promise a job.
Yes — shrimp exporters, feed and processing plants, rice mills, port service firms and remote analytics teams regularly hire freshers who can show SQL, a dashboard tool and finished projects. First salaries typically fall around ₹3–6 LPA.
Indicative ranges: freshers about ₹3–6 LPA, a few years in roughly ₹6–10 LPA, seniors around ₹10–15 LPA. Nellore jobs often pay a step below Chennai or Hyderabad for the same title; Uncodemy won't promise a number.
The usual first designation is Data, MIS or Business Analyst; later on, Nellore alumni move toward supply-chain analytics, BI engineering, production planning or operations roles.
A completed degree in any subject is the only requirement. No coding or analytics background is assumed; batches mix college finalists, farm and mill staff, and career changers.
No — they're estimates, like a pond's expected harvest. They come from our placement records and public review platforms, which change over time; individual results depend on skill, background, location, employer and market, and the lender decides EMI eligibility.
No. Uncodemy's only physical classrooms are in Delhi and Noida, so learners from Nellore attend the same batches live online. If you happen to be in Delhi, the centre is in Shakarpur Extension, a short walk from Nirman Vihar Metro.
Our hiring network includes more than 850 companies, such as upGrad, Fiserv, Clarivate, Genpact and HSBC. Past learners have joined HSBC and Fiserv as Business Analysts, Genpact as a Process Developer Analyst and Clarivate as an Intellectual Property Analyst.
Real projects from past batches — open the code on GitHub, see who mentored it, then try the Nellore version on each card using data from Nellore & the Andhra coast.
 UncodemyDATA ANALYTICS
Learners take a supermarket chain's raw till records, clean them with SQL Server and lay them out in Power BI so managers can compare outlets, weeks and product groups on a single page.
Nellore version: Run the same SQL Server + Power BI pipeline on aquaculture sales from Nellore and compare months, products and outlets.
 Python
 Excel
 Power BI
 SQL
 Ms. Rachna VermaData Analytics Trainer
 Sagar Bajirao ShembadeData AnalystUncodemyDATA ANALYST
From a simple entity sketch, learners build an online music shop's PostgreSQL tables in PgAdmin4 and query them to see which genres earn and which customers keep coming back.
Nellore version: Model a rice and agri-trade catalogue the same way and rank items, customers and areas of Nellore & the Andhra coast by revenue.
Power BI DAX
 CSV
 GitHub
 Dr. Vijay K. GuptaMD & CEO
 Ankit SinghData AnalystUncodemyDATA ANALYTICS
India's COVID-19 series becomes practice in handling patchy public data — gaps filled in Pandas, rates worked out with NumPy and state-wise waves drawn in Matplotlib.
Nellore version: Clean and chart public health or footfall data for Nellore & the Andhra coast with the same Pandas and Matplotlib workflow.
Python Pandas
 Jupyter NotebookGitHub
 Mr. Upendra Kumar TiwariSenior Data Science Trainer
 Shruti SaxenaData AnalystUncodemyDATA ANALYTICS
Python, SQL and Power BI are joined into a monthly pond-harvest, revenue and labour report for an imaginary shrimp-export company.
Nellore version: Build a scorecard of Krishnapatnam port logistics employers around Nellore — size, hiring trend and pay bands — with SQL and DAX.
PythonSQLPower BIDAXMs. Rachna VermaData Analytics Trainer Rajat KashyapData AnalystUncodemyDATA ANALYTICS
Learners mine many IPL seasons for patterns — death-over economies, venue effects, chasing success — and present them in more than 44 charts.
Nellore version: Swap IPL data for aquaculture seasonality in Nellore and show peaks, slumps and outliers in one dashboard.
PythonJupyter NotebookPower BISQLMr. Upendra Kumar TiwariSenior Data Science Trainer Pawan MehraData Analyst