


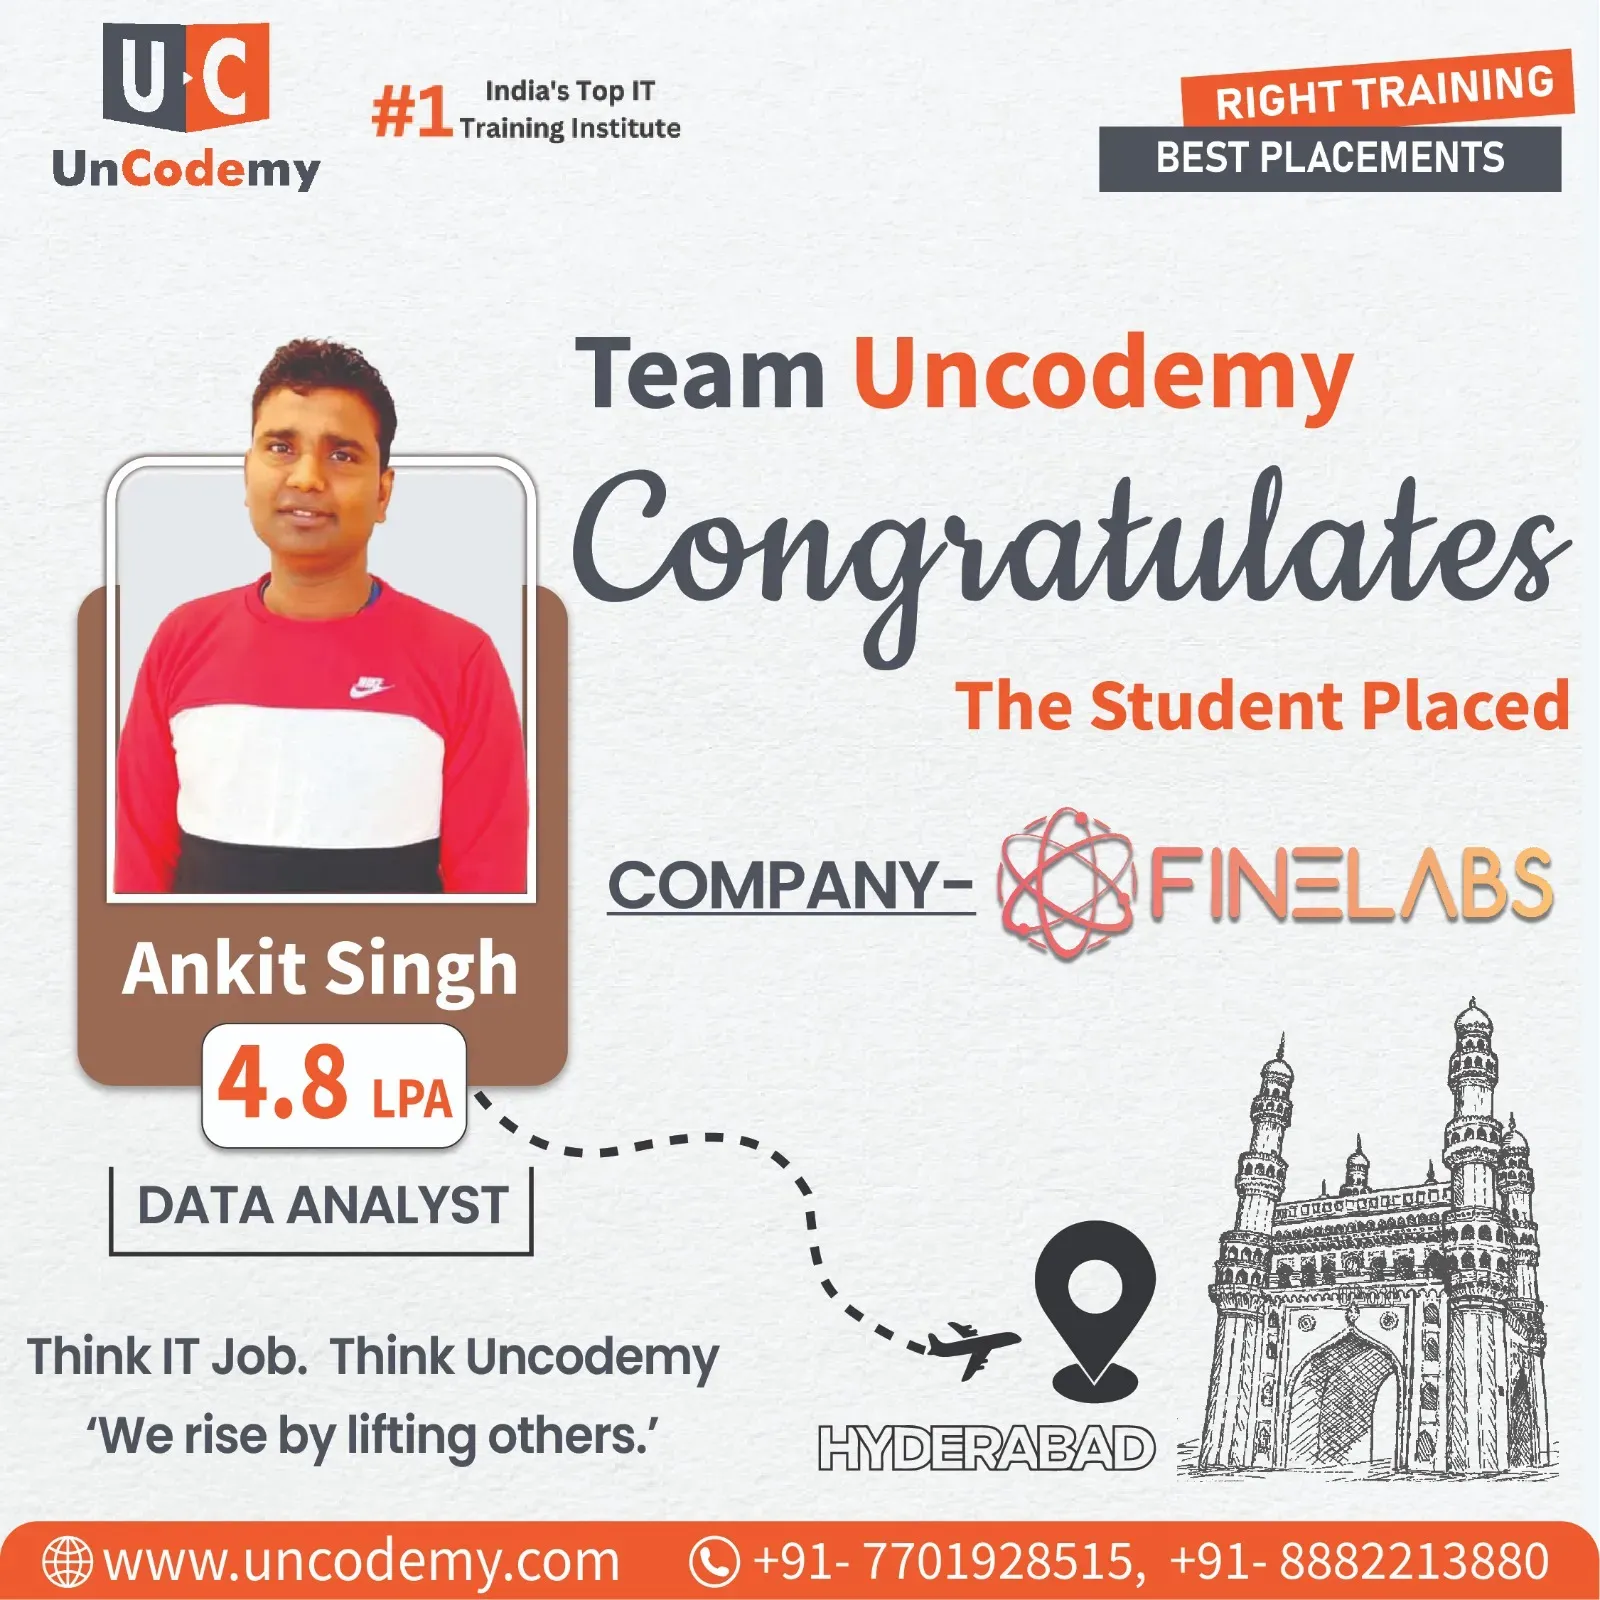
 4.8 LPAHyderabad
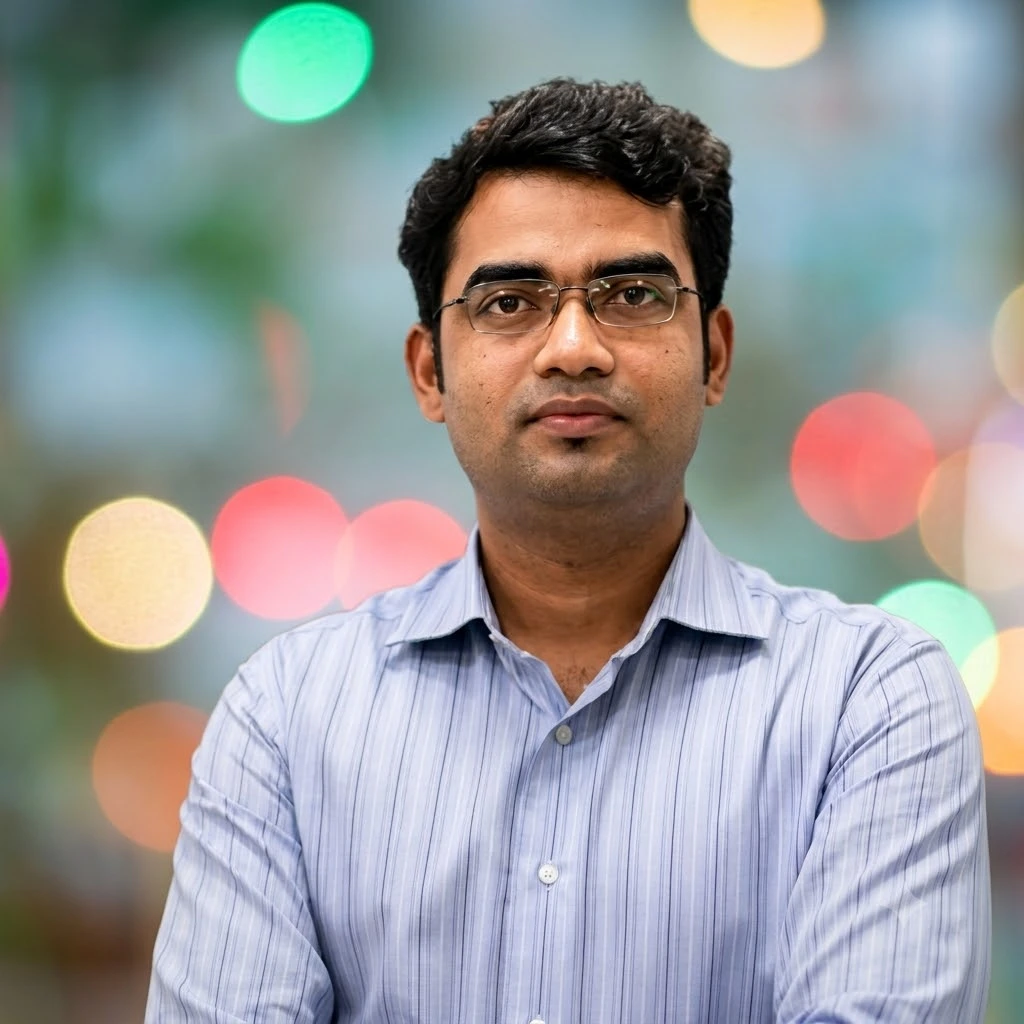
Ankit Singh
Data Analyst
- Placed at
- FINELABS
- Program
- Data Analytics Batch
- Batch
- DA/09/0823/S WD 7PM

Choose the best training program according to your career.

Improve the performance of your business with our innovative Industrial Training Program.
Read More →
Our instructor-led training classes are designed to make you an expert.
Read More →
Real-life case studies are a great way to demonstrate your practical knowledge.
Read More →
Explore blogs, latest technologies and industry updates with practical examples.
Read More →
Browse all available training programs and choose the right one for your career.
Read More →Know more about who we are and what we stand for.
Discover our mission to equip individuals with essential IT skills and industry expertise.
Read More →Learn, practice and plan your career — bilkul free.
Book a free video counselling session and pick the right course for you.
Read More →Saharanpur's carvers turn sheesham and mango wood into furniture and décor sold from Jaipur to Dubai, its orchards supply mangoes across the north, and its paper, sugar and cigarette factories employ thousands. Each of these trades now leaves a digital trail of orders, costs and shipments. Uncodemy's Data Analytics Course shows Saharanpur learners how to follow that trail and turn it into decisions, through 6–7 months of live online lessons in Excel, SQL, Python, Statistics, Power BI, Tableau and Generative AI.
There is no Uncodemy room in the Upper Doab. Lessons in person take place only in Delhi and Noida — the Delhi venue is in Shakarpur Extension, wall to wall with DSEU Ambedkar College and handy for the Nirman Vihar and Laxmi Nagar Metro Stations. From Saharanpur you join those same batches on a live screen and receive over 120 hours of teaching, 75-plus trainer sessions, real projects and a placement mentor who knows your goals. The cost is ₹17,500, or ₹20,650 once 18% GST is added.
Saharanpur learners progress through Excel, SQL, Python, statistics, Power BI, Tableau and Gen AI across six to seven months of live online lessons, using wood-craft export, paper-mill and fruit-trade examples, with a mentor checking in and an interview bootcamp at the finish.
By the last lesson, you'll be able to take an export order book, mill production log or mandi register you've never seen and hand back a clean, analysed and convincing story with the right course tool. After career preparation, eligible learners apply for analyst openings; here are some logged results.
4.8 LPAHyderabadData Analyst
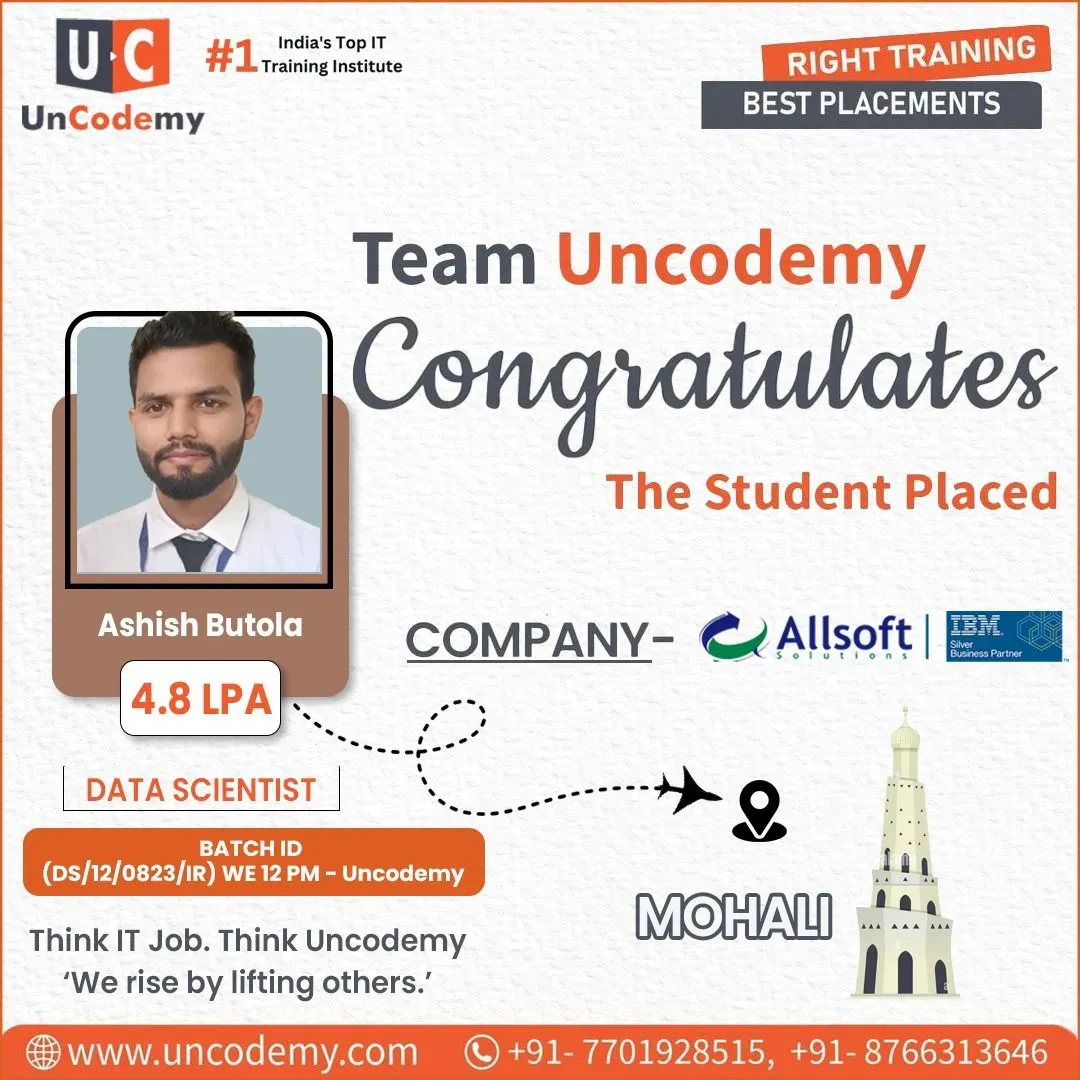 4.8 LPAIndia
Data Analyst
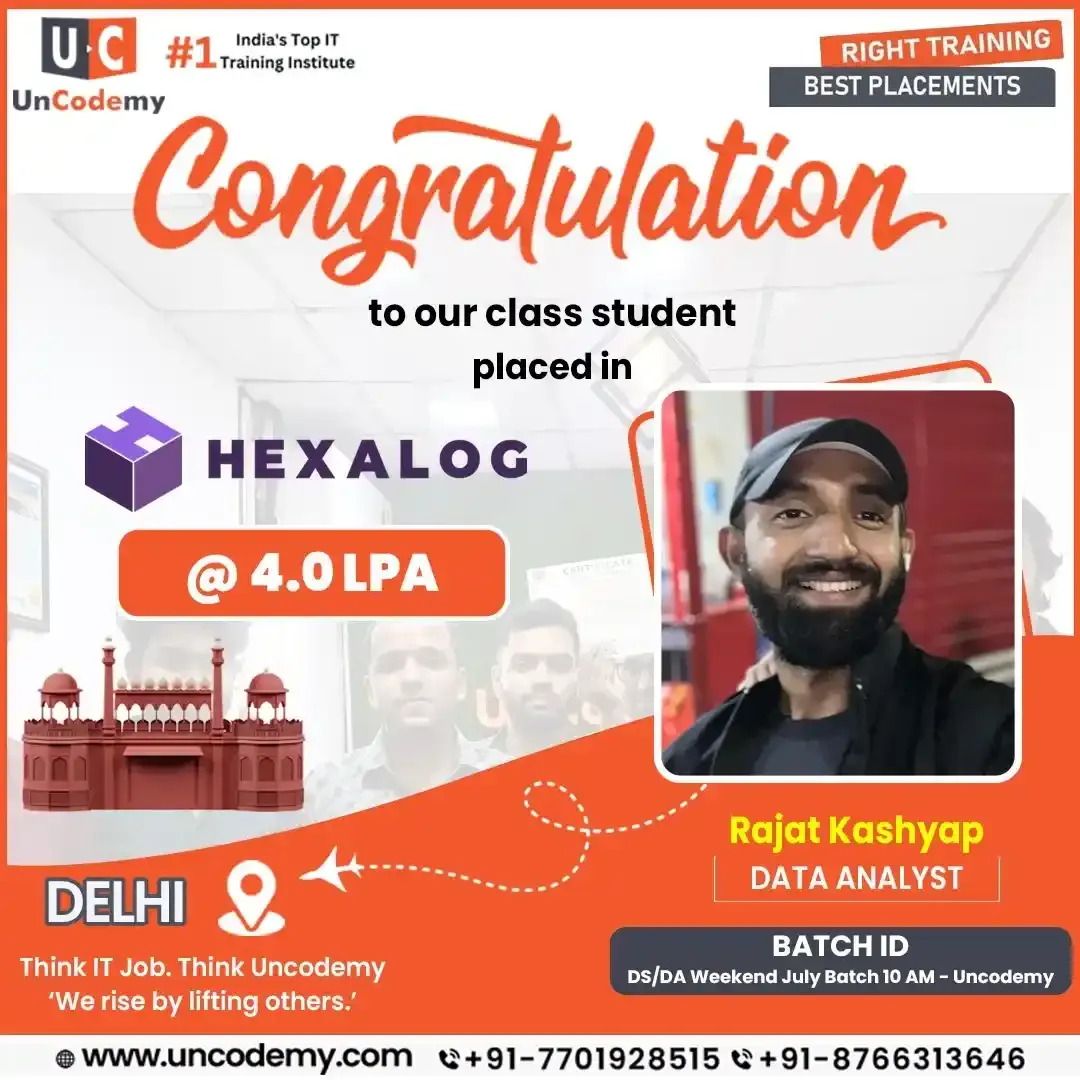 4.0 LPADelhi
Data Analyst
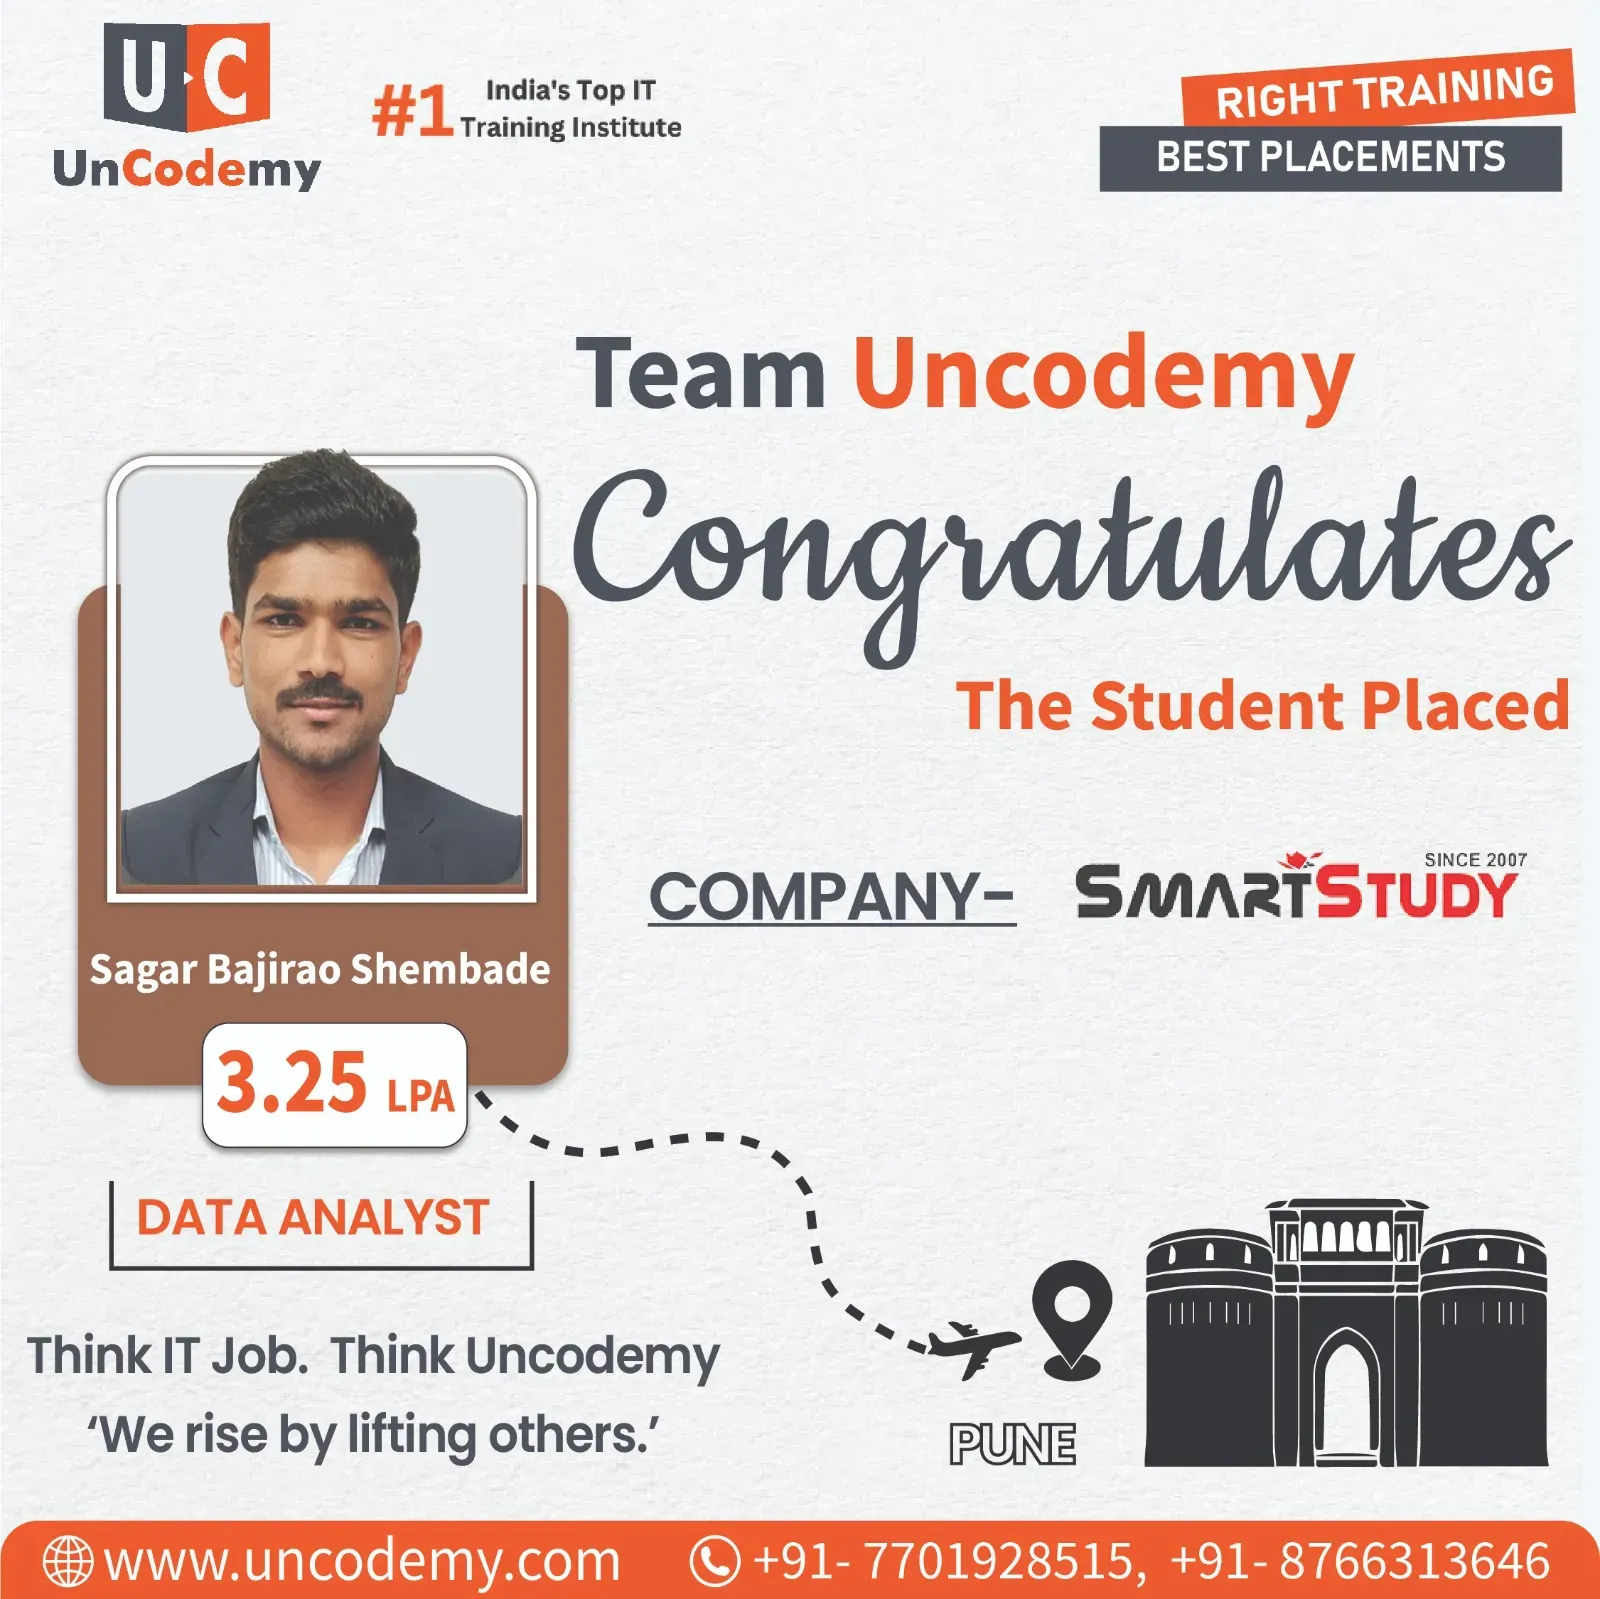 3.25 LPAPune
Data Analyst
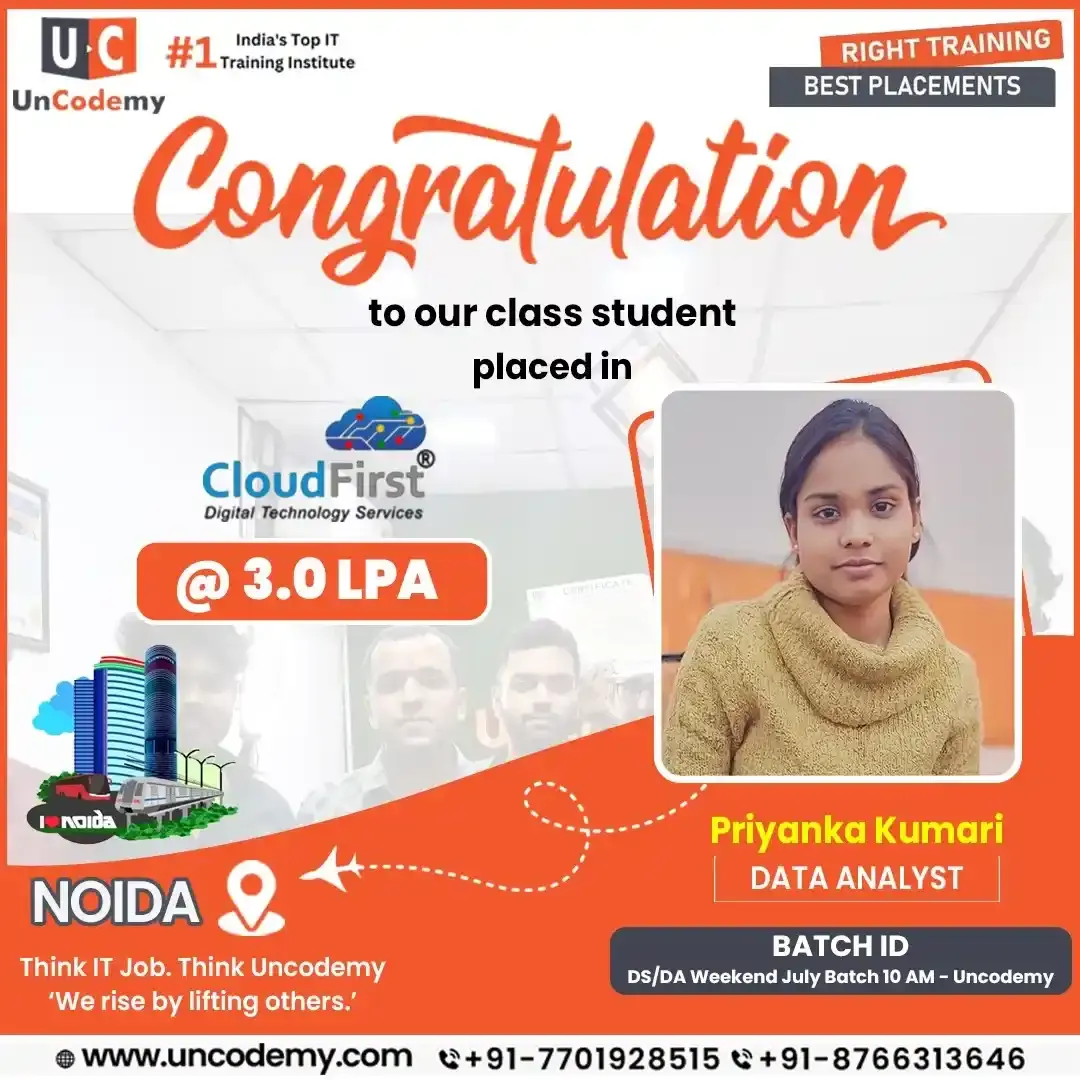 3.0 LPANoida
Data Analyst
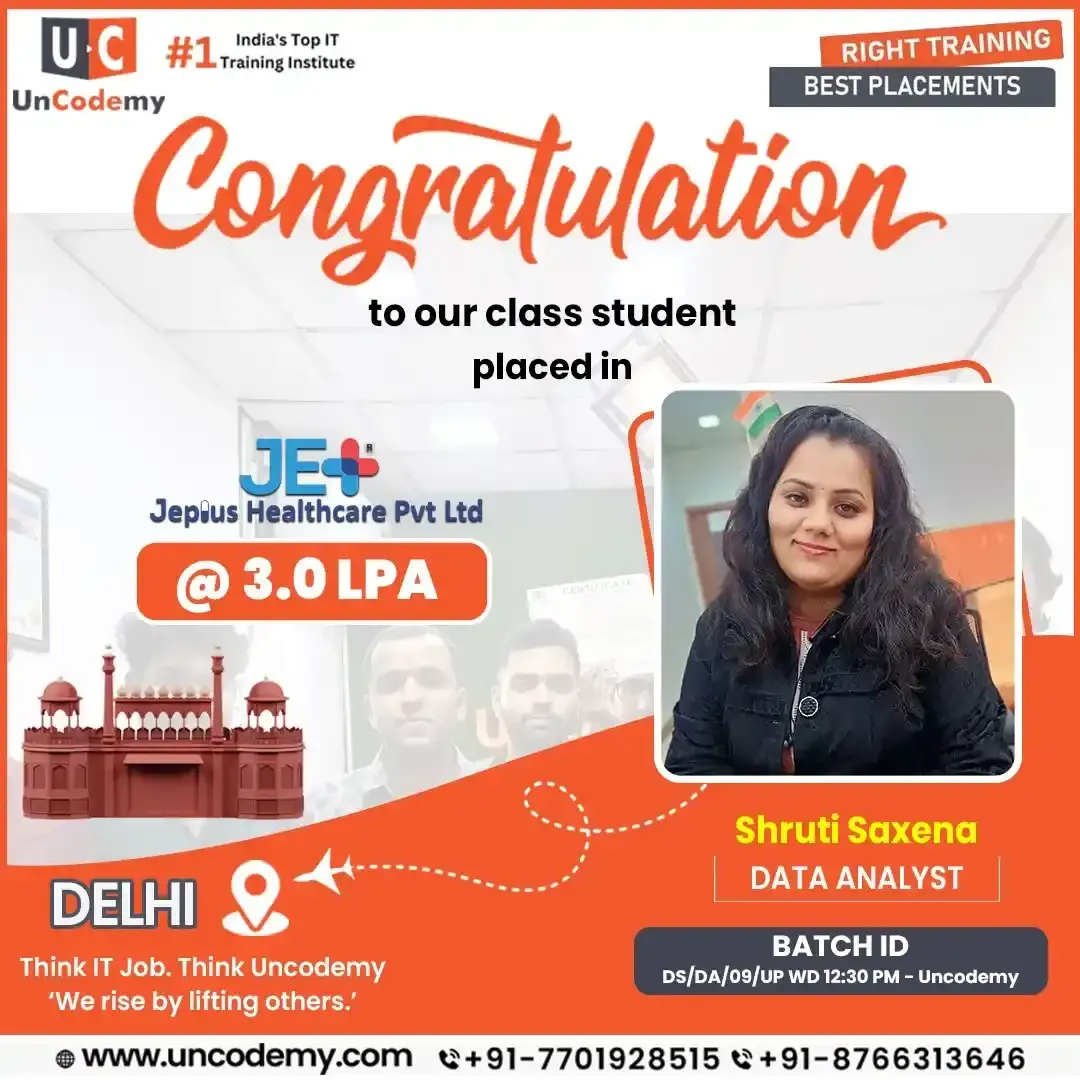 3.0 LPADelhi
Data Analyst
Location badges show where each learner was placed. Saharanpur learners join these same live online batches and the same career-preparation process; outcomes depend on individual effort and the job market.
A Saharanpur carving workshop may sell a hundred designs to buyers in a dozen countries. Which designs actually make money after timber, polish and freight? Which buyers come back, and which haggle every time? Data analytics answers questions like these by cleaning records, testing patterns with statistics and drawing results so the owner sees them instantly. Mills, banks, hospitals and colleges use the very same approach to understand people, watch performance, trim waste and plan ahead.
In a working week you'll pull figures from billing software or a database with SQL, mend broken entries and duplicate codes, compare designs, buyers or seasons in Excel or Python, lay out a Power BI or Tableau dashboard, and then talk the workshop owner, mill manager, exporter or accountant through what it means for pricing, production and follow-ups.
A woodcraft exporter illustrates the split. Analytics shows why orders from the Gulf slipped last year; data science forecasts which designs will sell next season; business analytics recommends what to produce, price and promote.
AspectStarting-salary ranges in the table are approximate and taken from the cited sources; your actual offer will reflect employer, role, ability, experience, city and market.
Saharanpur learners invest 6–7 months: over 75 live lectures and 120-plus learning hours. Spreadsheets and SQL open the course, Python and statistics deepen it, cleaning and exploratory analysis sharpen it, and Power BI, Tableau and Generative AI complete it. Craft, mill and orchard datasets feature throughout, every phase ends in a guided build, and your capstone headlines the portfolio.
Eligibility: A finished undergraduate degree, any stream, is the requirement (the eligibility criteria page lists specifics). Programming begins at zero, so there's nothing to learn beforehand. School arithmetic suffices to start — the statistics unit builds the rest. For lab sessions, a laptop with 8GB RAM and a reliable connection is advised.
Choose a weekday or weekend live batch — both are timed for students, workshop and mill staff, and office employees in Saharanpur. A free online demo lesson is available if you'd like to look before you leap.
Seats are limited and updated daily. All timings are in IST.
Across nine modules and more than 120 hours, the course retraces a real brief — locating records, repairing them, studying them, drawing conclusions, building visuals and presenting to whoever asked. Each module closes with a marked exercise on authentic data; the final module curates your strongest pieces.
| Module | Topic | Hours | Tools |
|---|---|---|---|
| 1 | Excel for Data Analytics | 12 | Excel, Power Query |
| 2 | SQL & Database Management | 18 | MySQL |
| 3 | Python for Data Analytics | 20 | Python, Pandas, NumPy |
| 4 | Statistics & Business Mathematics | 12 | Excel, Python |
| 5 | Data Cleaning & EDA | 12 | Python, Pandas |
| 6 | Power BI | 18 | Power BI Desktop |
| 7 | Tableau | 10 | Tableau Public |
| 8 | AI & Gen AI for Analysts | 8 | ChatGPT, Copilot |
| 9 | Capstone & Career Prep | 10 | All tools |
| Total | 120 Hours | 10+ tools |
Irshad Khan — Senior Trainer, 8+ Years Experience. Specialization: Data Science, Data Analytics, Business Analyst, SQL, Power BI, Python, Generative AI, Agentic AI.
Once you complete all nine modules, every assignment and the capstone, Uncodemy awards you its Data Analytics Program Certificate. It records the course title, how many months it ran, the tools you learned and the date you finished, and it carries a verification reference. You'll receive it only after coursework and assessments are cleared.
Exporters and corporate recruiters both like to see the work behind a credential, so your certificate comes with a portfolio — graded Excel, SQL, Python, statistics, Power BI, Tableau and Gen AI assignments and a capstone in which you solve a complete business case yourself.
Recruiters can confirm a Saharanpur learner's certificate online whenever they wish, using Uncodemy's official certificate portal.
Uncodemy Certificate Verification — Online Certificate Verification & Download: certificate.uncodemy.com
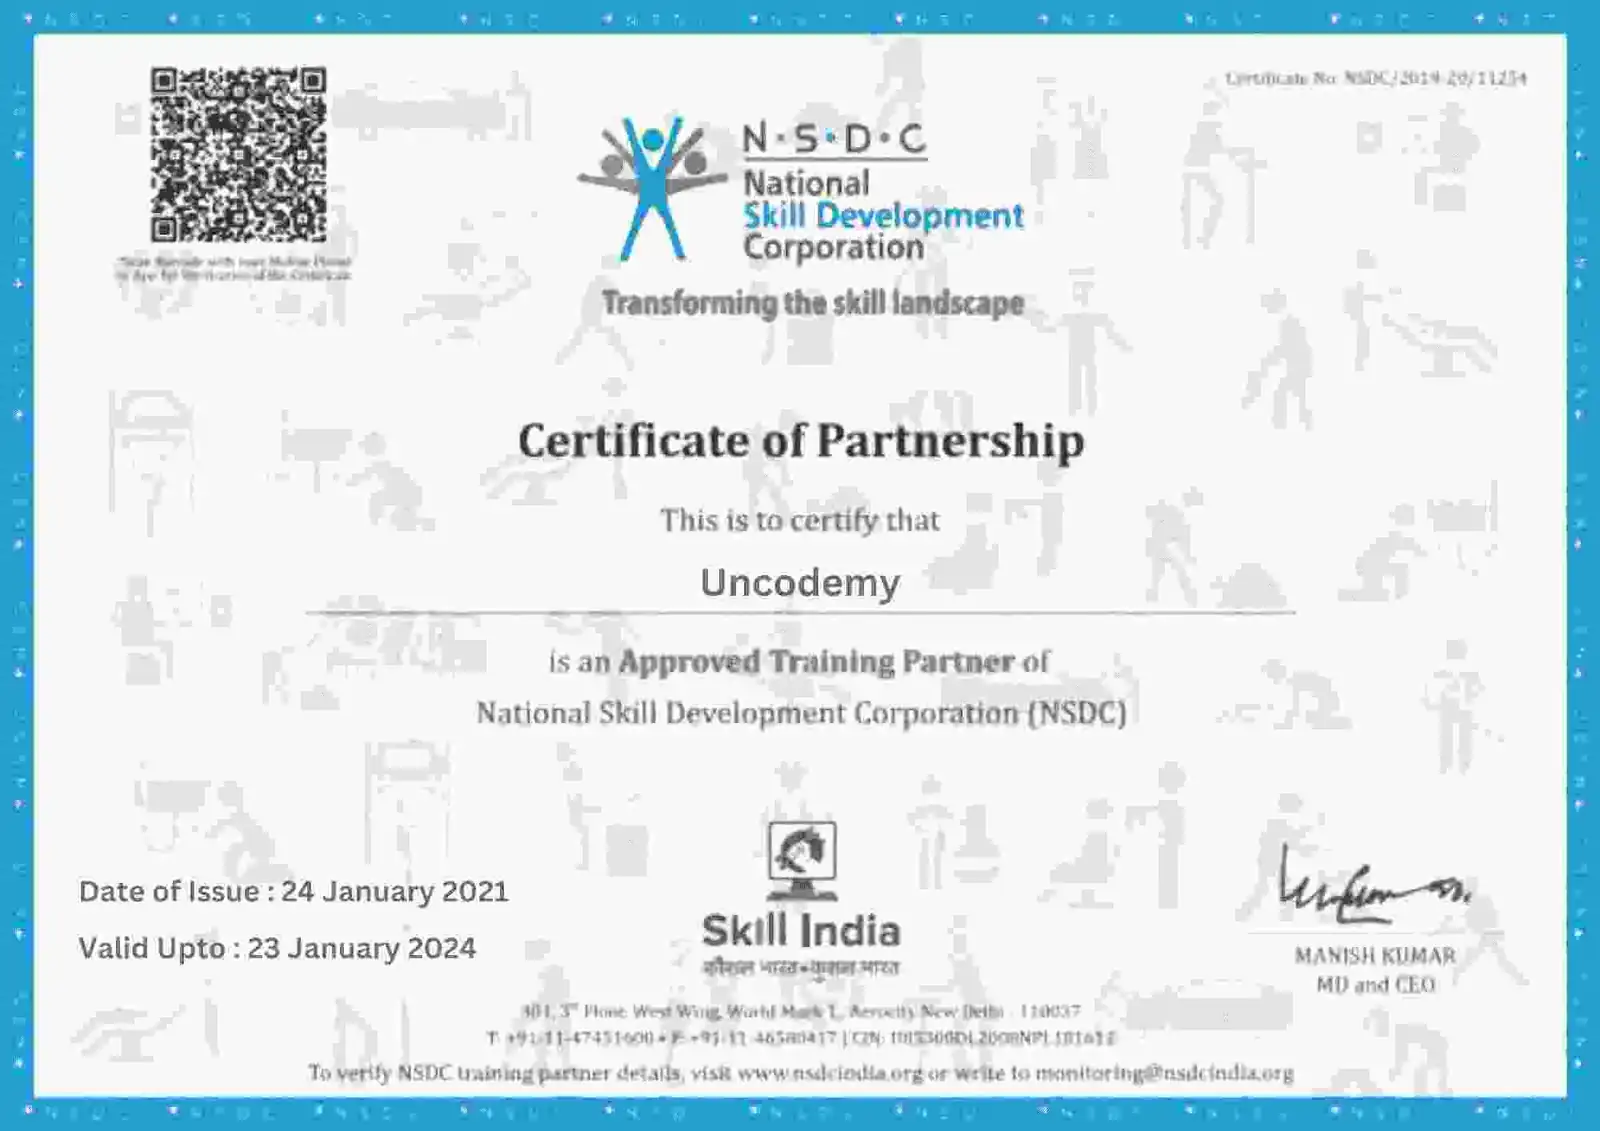

Uncodemy is operated by Uncodemy Edutech Pvt. Ltd. and shapes every course around one outcome: employability. You can learn in a classroom in Delhi or Noida, or — as Saharanpur learners do — in a live online batch that delivers identical teaching anywhere in India. Fellow learners include beginners, graduates, freshers and working people looking for practical skill.
Throughout this course you'll use Excel, SQL, Python, statistics, Power BI, Tableau and Gen AI on real datasets in project form. The work copies what analytics teams really do — keep an eye on key numbers, refresh dashboards, draft reports and guide decisions — so your first job won't feel foreign. Every module of the syllabus is published before you enrol.
Behind each lesson stands mentor time, marked practice, project reviews, interview rehearsal and job leads. Saharanpur learners receive the career support policy in writing before any fee is paid, so the scope, the limits and the qualifying conditions are clear upfront.
Prefer an adjacent subject? Learners in the Doab may sign up for Uncodemy's live online AI, ML, Data Science or Business Analysis tracks instead.
Make your move from Saharanpur — stream live lessons, practise on craft, mill and trade data, build a portfolio and get ready for analyst roles in the Doab, NCR or remote teams.
Saharanpur's wood-carving cluster is one of India's best known, with hundreds of workshops and export houses producing furniture, boxes and décor for domestic and international buyers. As larger exporters adopt order-management and ERP tools, they need people to analyse design profitability, timber costs, buyer behaviour and shipping timelines. Paper mills, a major cigarette factory, sugar mills and food-processing units in the district run their own production, quality and dispatch reporting.
The district's mango and fruit trade, cooperative and commercial banks, hospitals, colleges and retail businesses add further openings. Saharanpur's rail and road links to Dehradun, Haridwar, Chandigarh and Delhi widen the field, and many learners also aim for remote analytics jobs. Everywhere, SQL and a BI tool are assumed skills; you'll stand out if you can pin down the business question, choose the right measure and explain your recommendation in plain words.
Graduates head for Data Analyst, Business Analyst, MIS Executive/Analyst, Business Intelligence Analyst, Marketing/Product Analyst and Operations Analyst vacancies. Ask a carving exporter, they want margin by design; ask a paper mill, they want tonnes per shift; ask a lender, they want overdue accounts — every answer flows through SQL, a spreadsheet and a dashboard.
| Role | Core Tools |
|---|---|
| Data Analyst | SQL, Excel, Python, Power BI |
| Business Analyst | SQL, Excel, BI tools |
| MIS Executive / Analyst | Excel, SQL, Power BI |
| Business Intelligence Analyst | Power BI, Tableau, SQL, DAX |
| Marketing / Product Analyst | SQL, Python, BI tools |
| Operations Analyst | Excel, SQL, Power BI |
Saharanpur freshers usually begin as Data, MIS or Business Analysts and, two to four years later, specialise in BI, product, marketing or operations analytics. Some return to a family workshop and modernise its records. Promotion comes from owning complete analyses and learning your trade's vocabulary, not from stacking certificates.
Your pay will depend on experience, industry and how strong your SQL and BI really are, and two people with the same title can earn very different amounts. Stop at dashboards and you'll likely start low in the range; add efficient queries, structured problem-solving and confident recommendations and you'll start higher and rise faster.
| Career Level / Role | Indicative Salary Range |
|---|---|
| Entry-Level Data Analyst | ₹3–6 LPA |
| Data Analyst (Mid-Level) | ₹6–10 LPA |
| Senior Data Analyst | ₹10–15 LPA |
| Business Intelligence Analyst | ₹7–12 LPA |
Sources reviewed: AmbitionBox, Glassdoor, Indeed and Uncodemy placement records. Reviewed: 12 October 2026.
Workshops and local firms in Saharanpur often start below NCR or Chandigarh packages, while large mills, remote teams and metro employers tend to pay more within each band. Every figure is indicative and depends on role, skills, experience, location, employer and market. Uncodemy doesn't guarantee any salary or job.
Uncodemy's hiring network spans more than 850 companies across India, from big groups to start-ups. For learners in Saharanpur, analyst work is most often found in:
Wood carving and handicraft exports — design profitability, timber costing, buyer and shipment analytics
Paper, sugar and tobacco manufacturing — production, quality, energy and dispatch reporting
Fruit and agri-trade — mango arrivals, rate trends and cold-chain tracking
Cooperative and commercial banks, hospitals and colleges — overdue-loan, OPD and enrolment reporting
Dehradun, Chandigarh, NCR and remote roles — analytics jobs beyond the district
A carving exporter, a mill and a bank will test different things at interview, so pick your target early and let your portfolio speak to it.
Learning analytics is a little like carving: rough shaping, fine detail and polishing happen in order, and skipping a stage shows in the final piece. Gaps in your skills tend to surface in technical interviews or during your first months at work.
Shape your Excel — XLOOKUP, pivots and Power Query until a design-wise or buyer-wise summary takes minutes.
Carve out SQL — joins between order, stock and payment tables, grouped totals, subqueries and window functions; interviews nearly always begin here.
Bring in Python — when an exporter's order history spans thousands of lines across years, Pandas and NumPy take over, and a short script refreshes the monthly numbers automatically.
Reason with statistics — understand averages, spread, sampling error and regression slopes, so a doubtful owner accepts that a design really does earn more.
Finish one dashboard tool — Power BI using DAX, or Tableau using calculated fields — until an exporter could read your report without a single phone call to you.
Display your work — three to five portfolio projects, such as carving-design margins or mango-price seasonality, each ending with a recommendation.
Sell your skills — rehearse SQL against the clock, talk through business cases aloud, and rewrite the CV and LinkedIn so each line states an outcome.
Plan on roughly half a year of steady effort — an evening hour, kept up week after week, is what turns Saharanpur learners into confident interview candidates.
Analytics courses come in every size and price, from cheap weekend workshops to expensive bootcamps. To make comparison easy, here's exactly what you get with Uncodemy.
| Factor | This Program |
|---|---|
| Duration | 6–7 months |
| Learning hours | 120+ hours |
| Tools covered | 10+ tools |
| Gen AI module | Dedicated 8-hour module |
| Projects | 5 guided + 1 capstone |
| Career support | Resume, LinkedIn, mock interviews, hiring network |
It's longer and covers more tools because employers now expect a fresher to tidy data in Excel, query it in SQL, script parts in Python and present it on a dashboard — sometimes in one assignment. Recorded self-paced courses cost less; if you only want sharper Excel and Power BI for your own workshop, one of those could be enough.
Whichever format you pick, the syllabus, trainers, projects and fee stay the same. From Saharanpur, live online lessons are the natural fit: you learn in real time from home, get doubts answered straight away and arrange sessions around college, workshop hours or a job.
The nearest Uncodemy rooms are some 180 km south in Noida and Delhi's Shakarpur area, so a hybrid plan suits only frequent NCR visitors. Remote learners keep every entitlement — live teaching, recordings, doubt clinics, placement help — and an approved format switch carries progress across.
| If you want... | Recommend |
|---|---|
| Only Excel + Power BI basics | A shorter course may be sufficient |
| Full analyst career transition | This program |
| Heavy ML/Data Science | Choose Data Science |
| Business-focused analytics | Consider Business Analytics |
| Self-paced learning | Recorded course |
Who you will learn from in Saharanpur. Live sessions for Saharanpur are delivered online by the Delhi–Noida faculty. Irshad Khan, Senior Trainer for Data Analytics, leads the batch and approved the syllabus on this page, while Upendra Kumar Tiwari reviews its technical accuracy as a separate domain reviewer.
Learners from Saharanpur & the Upper Doab often work with wood-carving exports, paper and sugar and fruit and agri-trade records, so mentors encourage projects drawn from those sectors — sales registers, stock sheets, booking logs — giving your portfolio something local employers recognise, alongside NCR and remote teams.
Names, domains and LinkedIn profiles of every trainer are public on the Uncodemy trainers page.

Data Analytics Trainer
Expertise14+ years in banking and insurance operations at Aon Hewitt, NIIT Technologies and Coforge, now teaching Excel, SQL, Python and Power BI through real business scenarios.
MIS reports and Excel dashboards for leadership tracking SLAs, error rates and backlog, SQL data cleaning and validation across systems, and live Power BI dashboards.

Data Analytics Trainer
Expertise5+ years across roles at Concentrix, Amazon and Tech Mahindra. A certified Data Scientist who now teaches data science and analytics as Academic Faculty at Uncodemy.
Credit risk management analytics at Tech Mahindra, business communications analytics, and chatbot solutions built with prompt engineering and machine learning.
Senior Data Science Trainer
Expertise15+ years of industry experience building production machine learning systems for retail, telecom and consulting teams.
Modelling security breaches in iOS apps, dormant customer prediction and factor analysis, last-mile delivery optimisation, and credit card fraud detection.
Data Analytics & AI Trainer
Expertise8+ years across consulting and public-sector analytics, with deep hands-on work in AI and MLOps delivery.
Built an OCR model, a disease-prediction model, and a fraud-control model deployed across every Indian state under the Ministry of Health & Welfare.

Data Analytics & AI Trainer
Expertise7+ years turning aviation and enterprise data into forecasting models, dashboards and AI assistants.
AI agent chat/voice bot, AI-driven data analysis, a sales-forecasting ML model, NPS data model evaluation, and a face-recognition model for biometrics.

Data Analytics Trainer
Expertise5+ years in logistics and consumer-brand analytics, with a strong focus on time series, NLP and applied automation.
Speech-to-text using core NLP (T2S), talent acquisition research, and product launch & CMS work on keventers.com using Sparktech.
Data Analytics Trainer
ExpertiseTrainer for the analytics and business intelligence track at Uncodemy, working with learners on Excel, SQL and BI tooling from first principles to interview-ready projects.
Guides classroom capstones on sales and customer dashboards, KPI reporting and end-to-end data cleaning workflows.

Data Analytics Trainer
Expertise3+ years building generative AI and machine learning systems, now Senior Gen AI Engineer at Uncodemy, with deep work in RAG, knowledge graphs, data analysis and AWS.
NEMI, an enterprise memory system built on RAG, knowledge graphs and vector databases, plus automated web-scraping bots and generative AI chatbots and predictive analytics for startups.

MD & CEO
ExpertiseFounder, MD & CEO of Uncodemy and GS Net Academy, with experience in education, technology leadership, research, mentorship and career development.
Leads strategic direction, academic initiatives, technology-driven education programs and mentorship across Uncodemy and GS Net Academy.
CEO & Founder
ExpertiseCEO & Founder of GvCloud Secure and Uncodemy with 14+ years of professional experience building scalable web, mobile and AI-driven solutions for clients across India, USA, UK, Canada, Australia and Singapore.
Leads technology strategy, scalable web and mobile solutions, AI-driven products and EdTech initiatives across Uncodemy and GvCloud Secure.
You'll need six to seven months. That covers more than 75 live online lessons and upward of 120 learning hours, in a weekday or weekend batch that fits around Saharanpur's college or workshop timings.
No coding background? That's normal here. Many Saharanpur learners come from commerce, agriculture or arts, and the first SQL lesson is a single SELECT line while Python starts with variables. Months one and two lean heavily on Excel and SQL.
Upward of ten. Data handling: SQL with Python's Pandas and NumPy. Inference: Statistics. Presentation: Excel, Tableau and Power BI. Speed-ups: Copilot and ChatGPT.
There's an eight-hour Gen AI module — Module 8. You'll learn to describe a data problem to an AI assistant, check whether the SQL or Python it suggests is right, use Copilot inside Excel and Power BI, and catch made-up numbers before they travel.
You'll complete six: five guided projects on retail, banking, HR, e-commerce and healthcare data, and a capstone of your own. A carving-export or mango-trade dataset would make your Saharanpur portfolio memorable.
Lessons happen in real time, all 75-plus of them, led by a trainer who takes questions as you go. Recordings are uploaded later for revision, and the classroom, online and hybrid groups share a single syllabus.
From the Doab, the full fee is ₹20,650: ₹17,500 plus 18% GST. It already pays for lessons, notes, project reviews, certification and placement support, and EMI starts at ₹4,032 monthly.
Instalments are available from ₹4,032 a month. Your counsellor will settle the tenure, exact amount and approval with the financing partner you prefer.
Sure — a no-charge trial lesson can be booked from Saharanpur. Sit in, quiz the trainer and scroll through the module plan before deciding. A call or WhatsApp is all it takes.
Our placement desk reworks your CV and LinkedIn, critiques your portfolio, stages mock interviews and forwards openings from 850-plus recruiters. The company makes the hiring call, so we never promise a job.
Freshers do get hired. Export houses, mills, banks and remote analytics teams take on newcomers who can show SQL, a BI tool and finished projects. Expect starting pay of roughly ₹3–6 LPA.
Ballpark figures: ₹3–6 LPA to begin, ₹6–10 LPA after some years, ₹10–15 LPA for seniors. Workshops and mills in the district often pay below Chandigarh, NCR or remote employers for the same title; no number is guaranteed.
Woodcraft-town alumni tend to start as Data, MIS or Business Analysts; a few years later they're found in BI engineering, reporting leadership, marketing or product analytics, and operations roles.
Got a degree — any degree? Then you qualify. Coding or analytics experience isn't required, and Saharanpur batches combine college finalists, workshop and mill staff, and people switching careers.
They aren't guarantees. They come from Uncodemy's placement records and public review sites, and both change. Your result depends on your skills, experience, location, employer and the market; lenders decide on EMIs.
Not locally. Classroom teaching exists only in Delhi and Noida, so Upper Doab learners follow identical batches over a live connection. When visiting Delhi, drop in at Shakarpur Extension, walking distance from Nirman Vihar Metro.
The recruiter list passes 850 companies — Clarivate, Fiserv, upGrad, HSBC and Genpact among them. Our records show alumni hired at HSBC and Fiserv as Business Analysts, at Genpact as a Process Developer Analyst and at Clarivate as an Intellectual Property Analyst.
Real projects from past batches — open the code on GitHub, see who mentored it, then try the Saharanpur version on each card using data from Saharanpur & the Upper Doab.
 UncodemyDATA ANALYTICS
You'll tidy a retailer's sales tables in SQL Server and build a Power BI page where managers can filter revenue by region, month and category, each chart answering a written requirement.
Saharanpur version: Run the same SQL Server + Power BI pipeline on wood-carving exports sales from Saharanpur and compare months, products and outlets.
 Python
 Excel
 Power BI
 SQL
 Ms. Rachna VermaData Analytics Trainer
 Sagar Bajirao ShembadeData AnalystUncodemyDATA ANALYST
You'll design an online music shop's PostgreSQL database in PgAdmin4 from a schema sketch, then query it to find popular genres, loyal customers and growth opportunities.
Saharanpur version: Model a fruit and agri-trade catalogue the same way and rank items, customers and areas of Saharanpur & the Upper Doab by revenue.
Power BI DAX
 CSV
 GitHub
 Dr. Vijay K. GuptaMD & CEO
 Ankit SinghData AnalystUncodemyDATA ANALYTICS
You'll work through India's COVID-19 record, fixing reporting gaps in Pandas, calculating rates with NumPy and plotting state-wise waves in Matplotlib.
Saharanpur version: Clean and chart public health or footfall data for Saharanpur & the Upper Doab with the same Pandas and Matplotlib workflow.
Python Pandas
 Jupyter NotebookGitHub
 Mr. Upendra Kumar TiwariSenior Data Science Trainer
 Shruti SaxenaData AnalystUncodemyDATA ANALYTICS
You'll chain Python, SQL and Power BI together to produce an HR, revenue and productivity report for a fictional furniture distributor.
Saharanpur version: Build a scorecard of paper and sugar employers around Saharanpur — size, hiring trend and pay bands — with SQL and DAX.
PythonSQLPower BIDAXMs. Rachna VermaData Analytics Trainer Rajat KashyapData AnalystUncodemyDATA ANALYTICS
You'll convert seasons of IPL scorecards into batting and bowling statistics and a set of 44-plus charts on players, venues and teams.
Saharanpur version: Swap IPL data for wood-carving exports seasonality in Saharanpur and show peaks, slumps and outliers in one dashboard.
PythonJupyter NotebookPower BISQLMr. Upendra Kumar TiwariSenior Data Science Trainer Pawan MehraData Analyst