


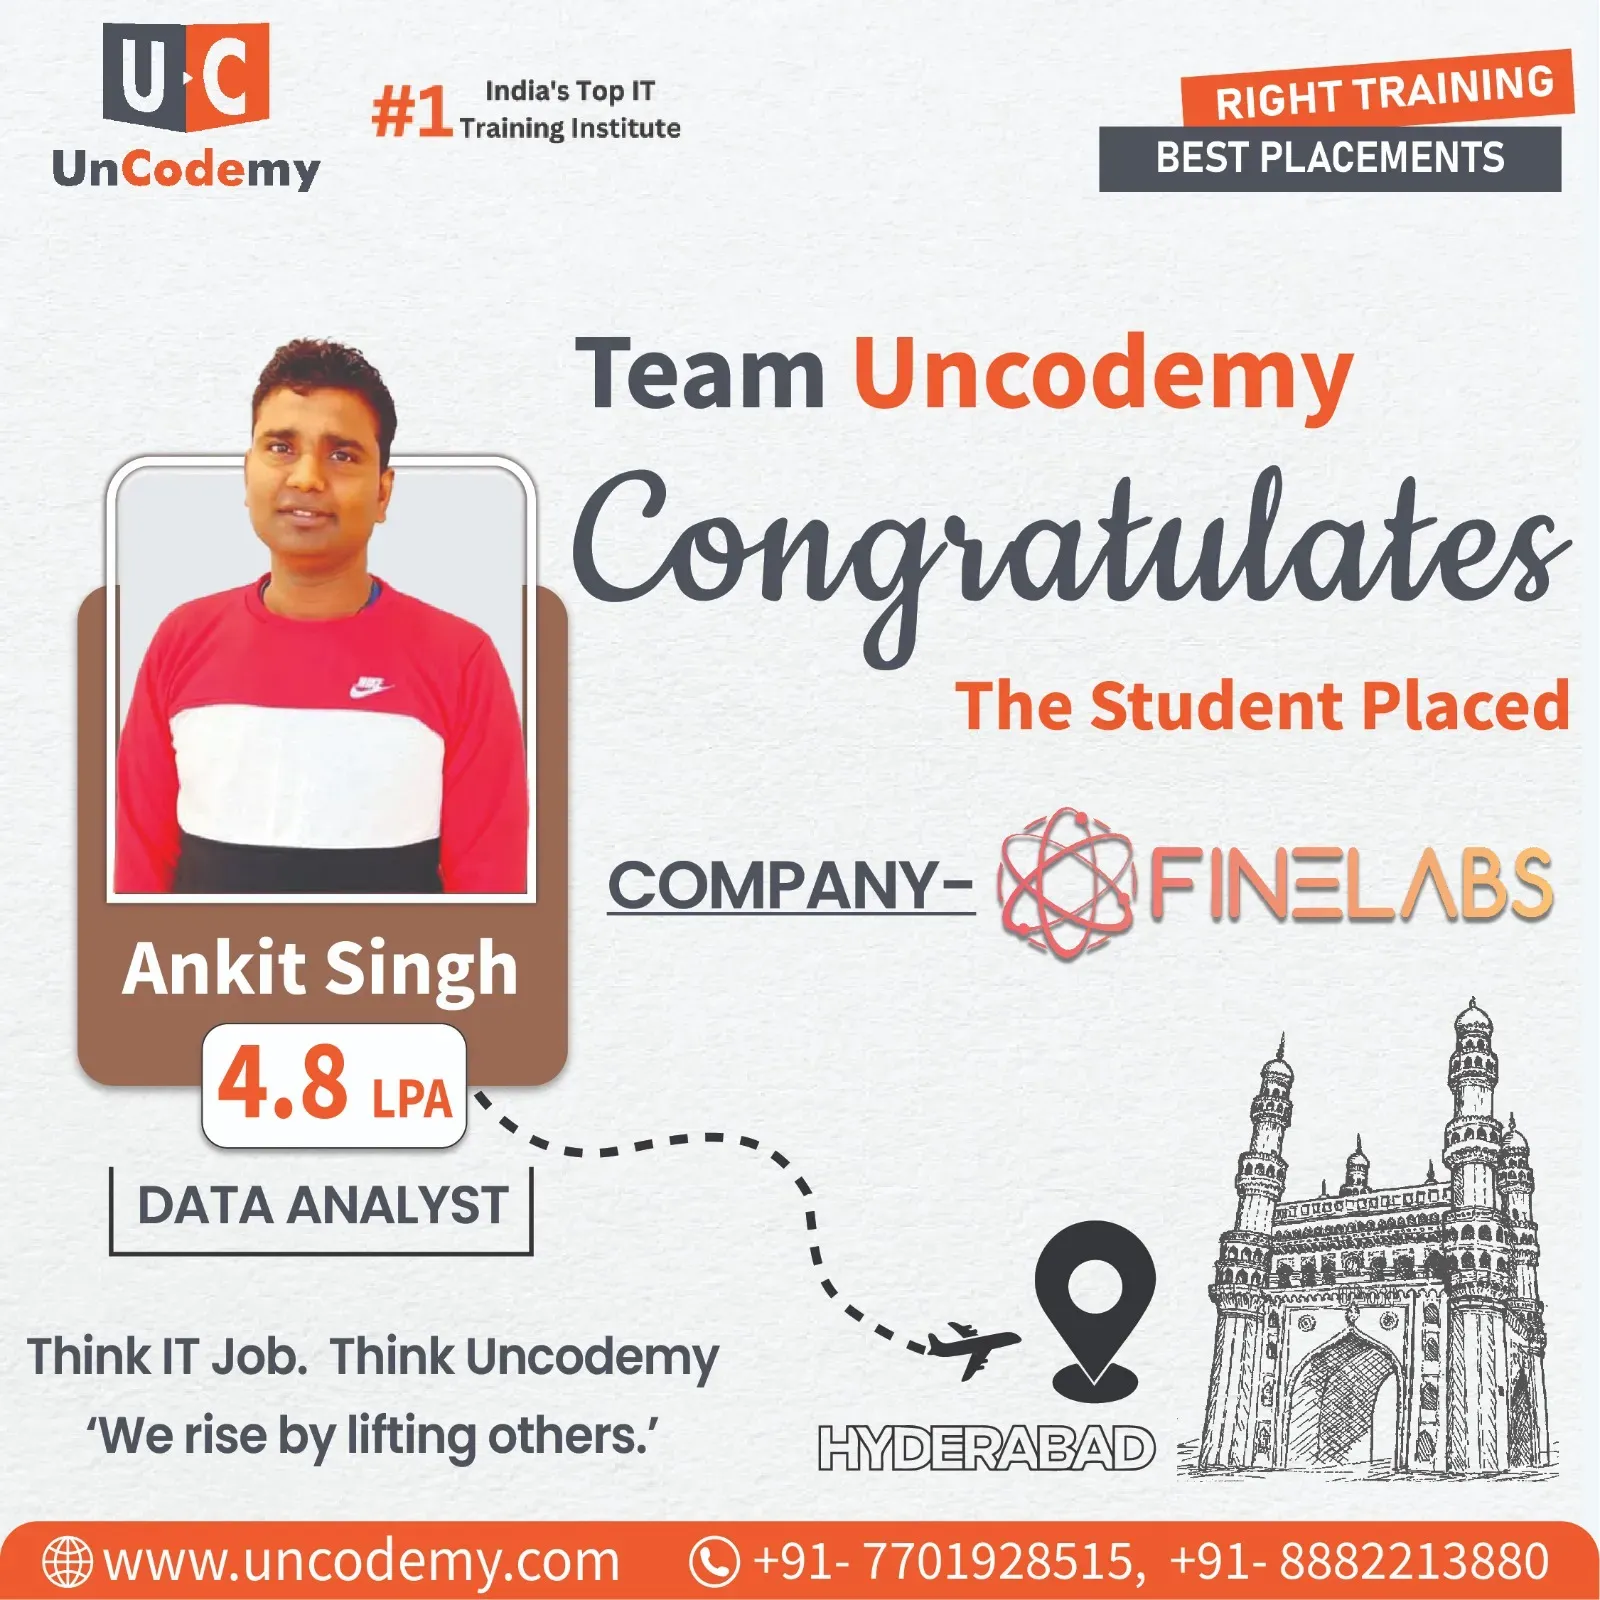
 4.8 LPAHyderabad
Ankit Singh
Data Analyst
- Placed at
- FINELABS
- Program
- Data Analytics Batch
- Batch
- DA/09/0823/S WD 7PM

Choose the best training program according to your career.

Improve the performance of your business with our innovative Industrial Training Program.
Read More →
Our instructor-led training classes are designed to make you an expert.
Read More →
Real-life case studies are a great way to demonstrate your practical knowledge.
Read More →
Explore blogs, latest technologies and industry updates with practical examples.
Read More →
Browse all available training programs and choose the right one for your career.
Read More →Know more about who we are and what we stand for.
Discover our mission to equip individuals with essential IT skills and industry expertise.
Read More →Learn, practice and plan your career — bilkul free.
Book a free video counselling session and pick the right course for you.
Read More →The Darjeeling Himalayan Railway leaves Siliguri Junction and climbs more than 2,000 metres to Ghum. A steep slope can't be taken head-on, so its engineers built zig-zags, where the toy train reverses to gain height, and loops, where the track circles back over itself. Learning data analytics is a similar climb: progress sometimes means stepping back to review a fundamental before moving higher. Siliguri sits at the foot of that climb and at a remarkable crossroads — the narrow 'Chicken's Neck' corridor linking the North-East with the rest of India, close to Nepal, Bhutan and Bangladesh. Here you find tea gardens across the Dooars and Terai, the Siliguri Tea Auction Centre, huge wholesale and transport trades, tourism heading to Darjeeling, Sikkim and Bhutan, timber and food processing, North Bengal Medical College and the University of North Bengal. Uncodemy's Data Analytics Course guides Siliguri learners up that track over 6–7 months of live online classes in Excel, SQL, Python, Statistics, Power BI, Tableau and Generative AI.
North Bengal has no Uncodemy room. Classroom teaching is confined to Noida and to Shakarpur Extension in Delhi, a building across from DSEU Ambedkar College near the Nirman Vihar and Laxmi Nagar Metro stations. Siliguri learners take a seat in those exact batches over live video — 120-plus hours, 75-plus trainer-led sessions, real-data projects and a placement mentor of their own — for ₹17,500, which 18% GST takes to ₹20,650.
Siliguri learners ride six to seven months of live online classes up the gradient — Excel, SQL, Python, statistics, Power BI, Tableau, Gen AI — using tea, transport, wholesale and tourism datasets; a mentor works each zig-zag with you, and mock interviews are the final loop before Ghum.
Arriving at the top, a Siliguri learner can take a jumbled ledger — a transport company's trip log, a tea garden's leaf-intake register, a Sevoke Road wholesaler's sales book — and climb from it to a clean, analysed and persuasive conclusion, choosing the right tool at every bend. Placement preparation follows, after which eligible learners apply for analyst openings; alumni examples from our records are listed.
4.8 LPAHyderabadData Analyst
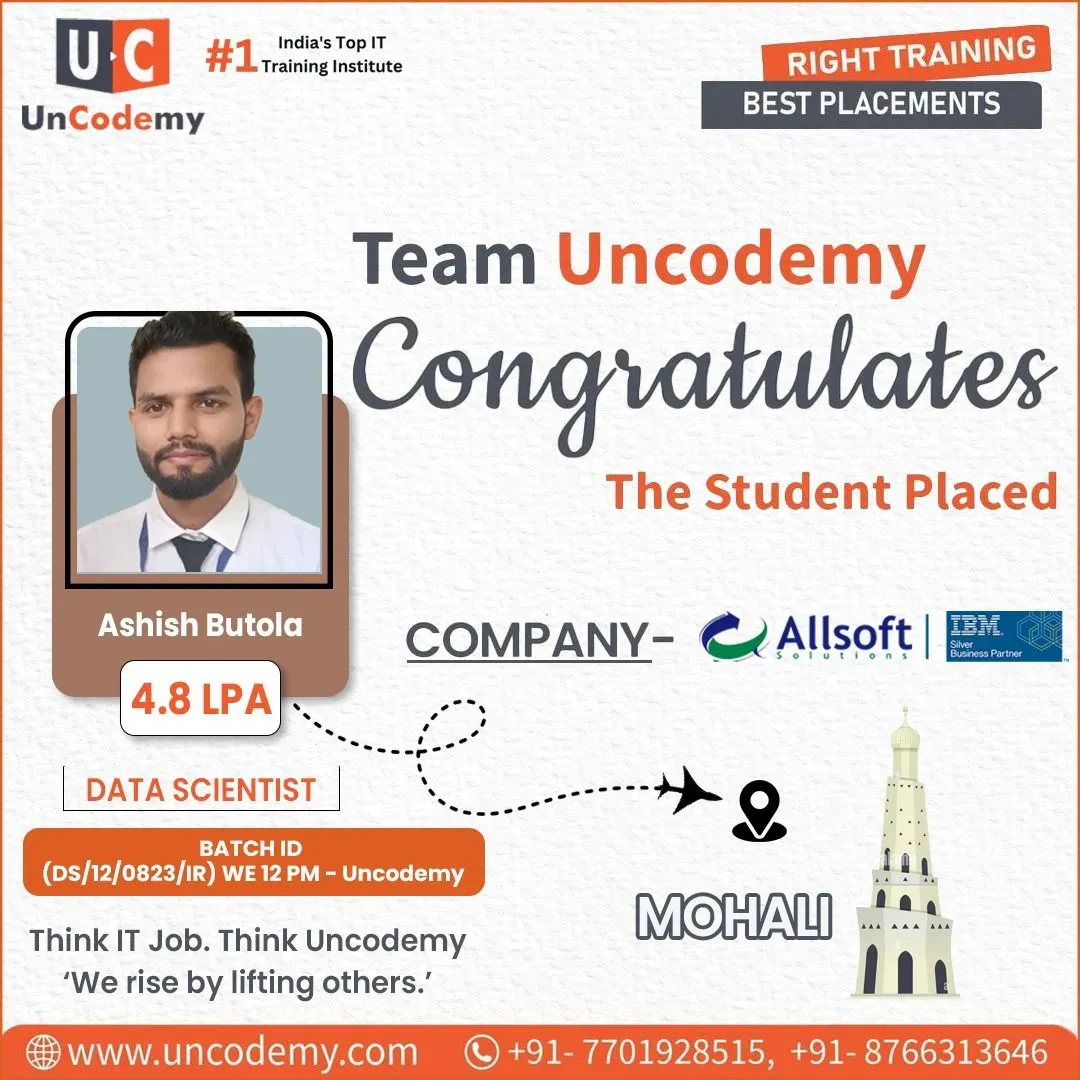 4.8 LPAIndia
Data Analyst
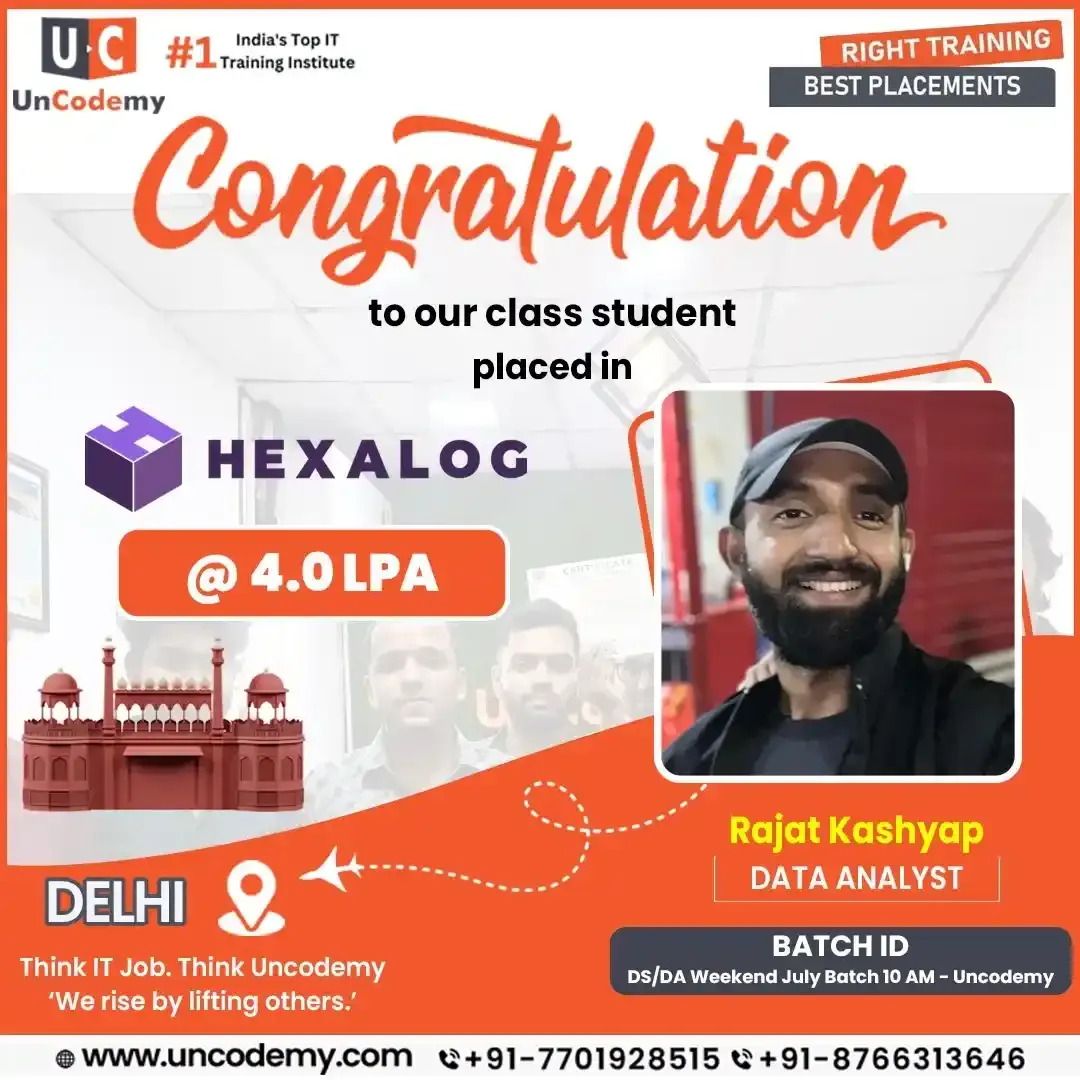 4.0 LPADelhi
Data Analyst
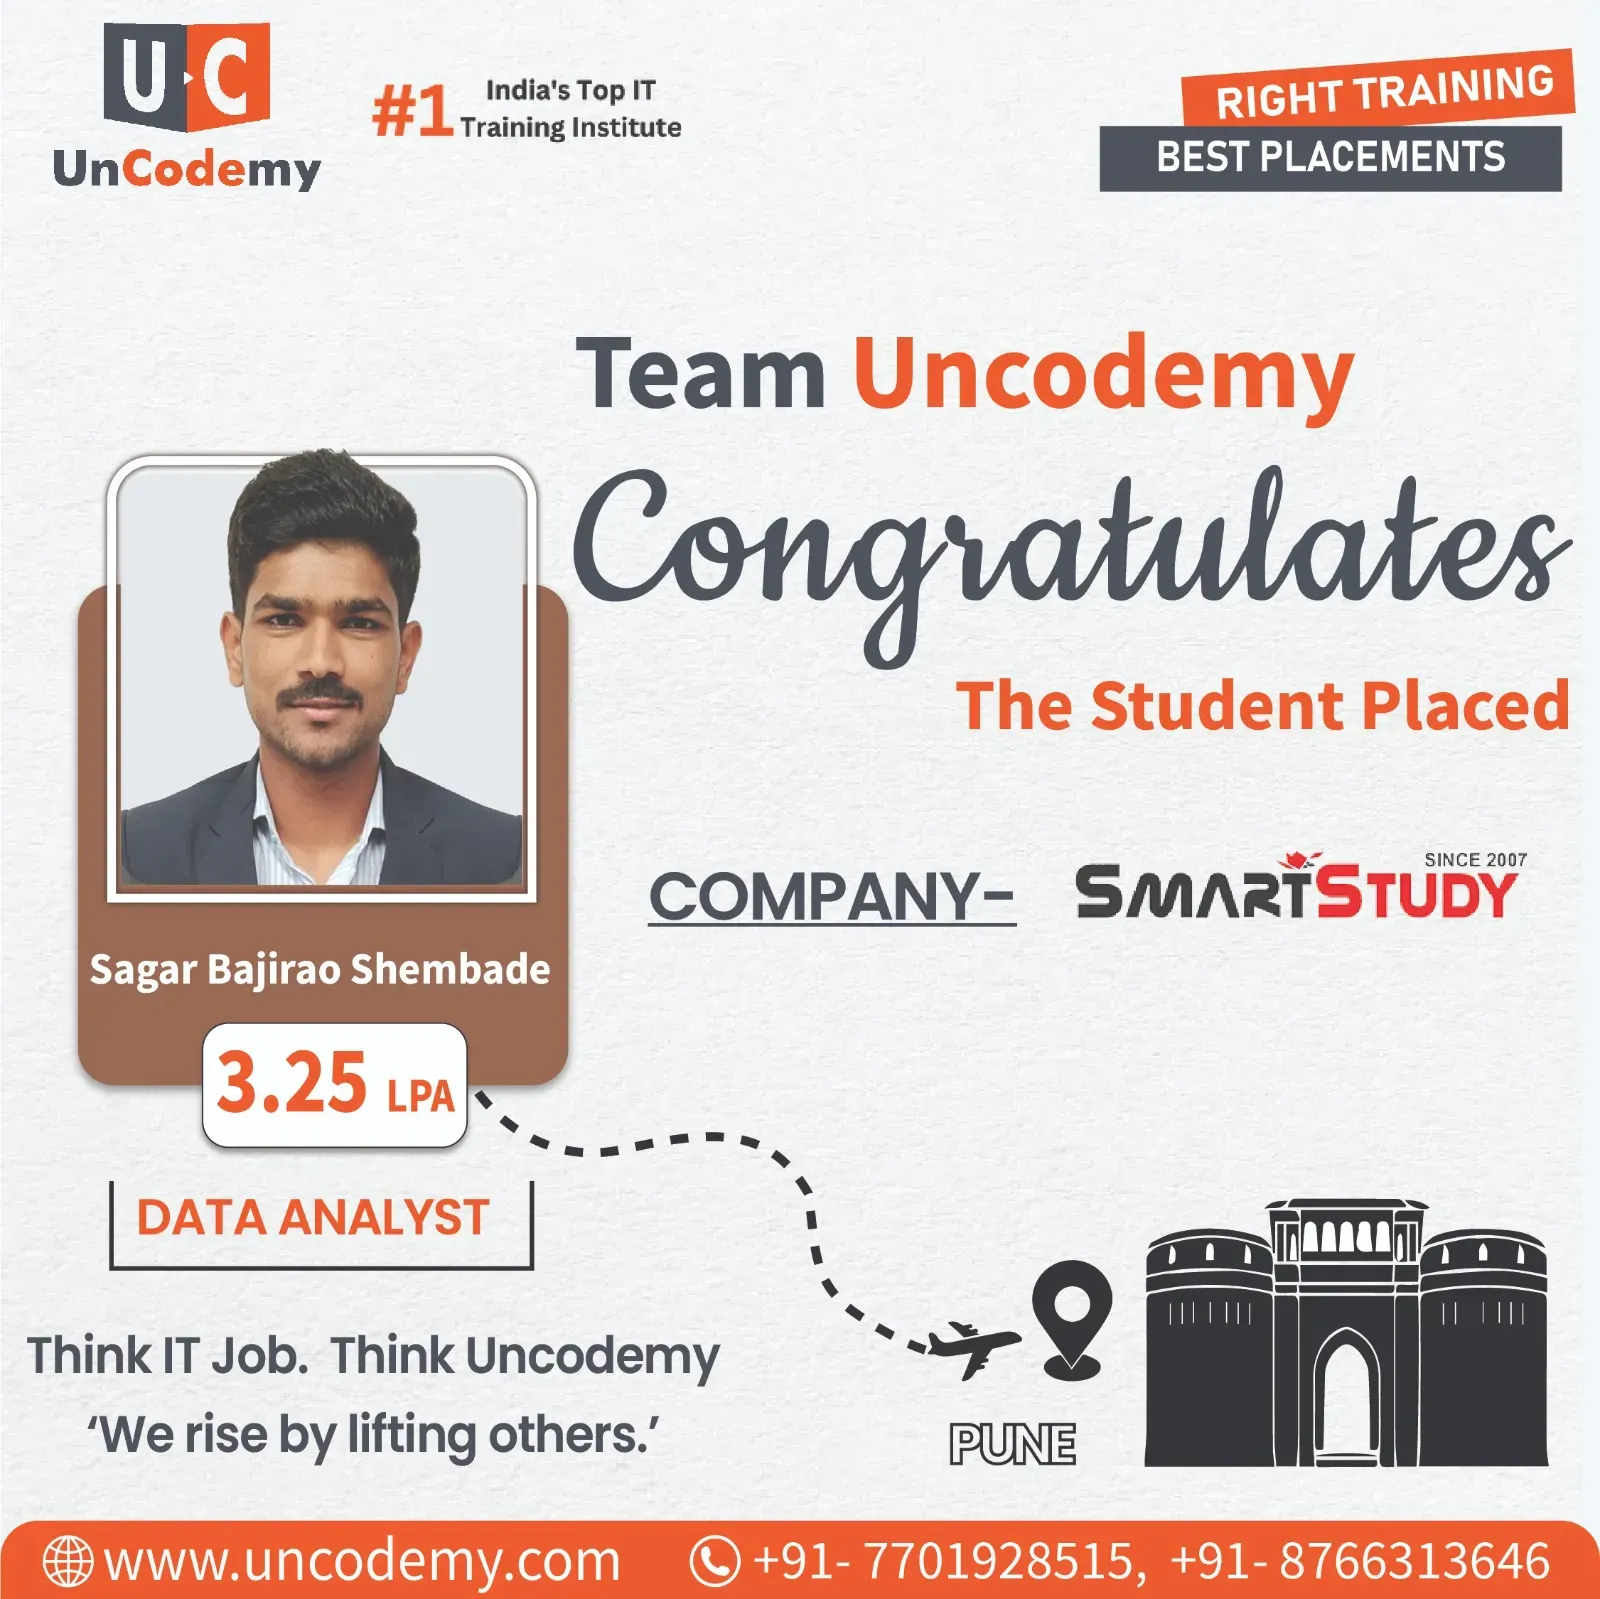 3.25 LPAPune
Data Analyst
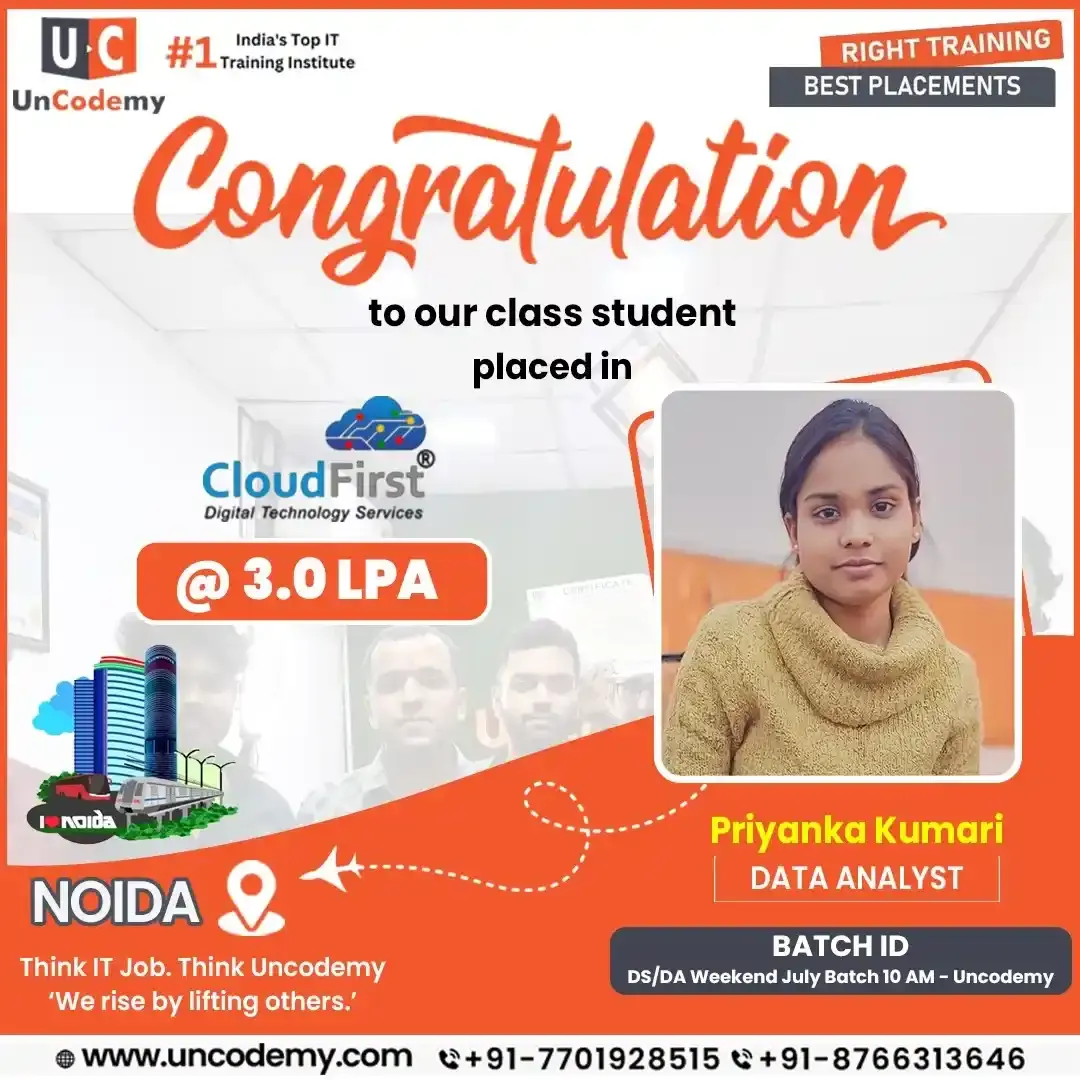 3.0 LPANoida
Data Analyst
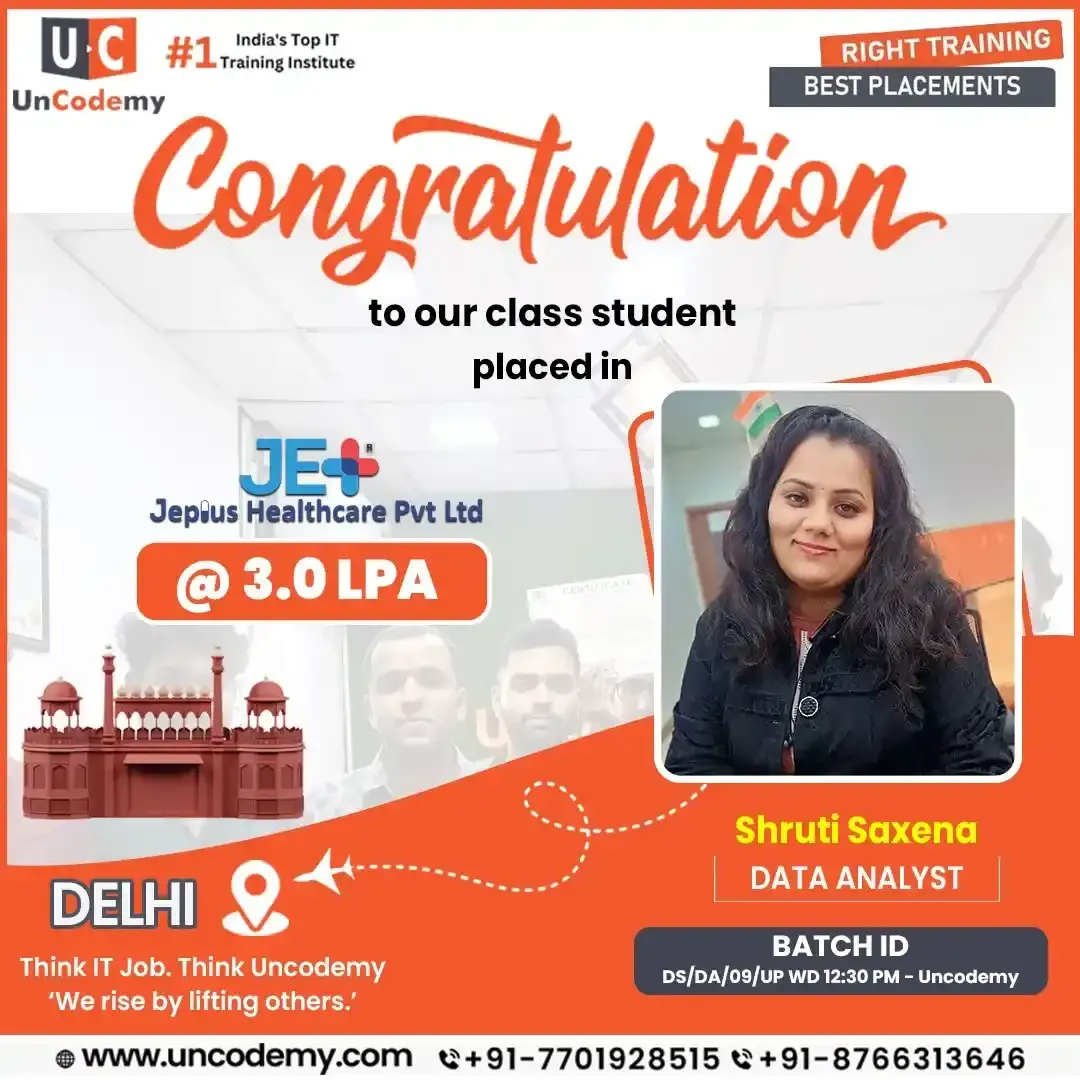 3.0 LPADelhi
Data Analyst
Location badges show where each learner was placed. Siliguri learners join these same live online batches and the same career-preparation process; outcomes depend on individual effort and the job market.
A Siliguri trucking firm hauling goods to Guwahati and Gangtok wonders why some routes lose money despite full loads; a Dooars tea estate wants to know which sections of the garden yield the best leaf; a homestay network in the hills sees bookings swing wildly with the weather and school holidays. Each holds the clues in its records, but the slope is steep. Data analytics builds the switchbacks — cleaning and organising data, testing patterns with statistics and delivering the view from the top as a chart a decision-maker can read.
A Siliguri analyst's week might mean SQL queries against a fleet, wholesale or hotel database, clearing duplicated entries and empty fields, comparing routes, garden sections or seasons in Excel or Python, building a Power BI or Tableau dashboard, and briefing an owner on where the business should head next.
Consider a Siliguri logistics company. Data analytics explains which routes ran at a loss last quarter; data science forecasts freight demand to the North-East and Sikkim; business analytics recommends pricing, fleet allocation and which contracts to bid for.
AspectStarting salary bands are rounded from the cited sources; offers in North Bengal depend on employer, role, skills, experience and timing.
Siliguri learners ride for 6–7 months — 75-plus live online sessions and 120-plus learning hours. The plains section is Excel and SQL; the climb through Sukna and Rongtong is Python, statistics, data cleaning and exploratory analysis; the final loops toward Ghum are Power BI, Tableau and Generative AI. Tea, logistics, wholesale and tourism data appear at every station, a guided project marks each halt, and the capstone is your arrival at the summit.
Eligibility: A graduate degree, any discipline, is all you need (see the eligibility criteria page). Nobody expects you to code on day one; SQL and Python begin at the bottom step. Class-ten arithmetic carries you through the start, and the statistics module adds the rest. Keep an 8GB-RAM laptop and a dependable internet line ready for the hands-on sessions.
Siliguri learners can choose weekday or weekend live batches, timed around garden seasons, transport schedules, tourist peaks and college. A free online demo class is open before joining.
| Date | Time | Trainer | Seats Left |
|---|---|---|---|
| 19 Oct | 02:00 PM – 03:00 PM | Mr. Upendra | 02 Seats |
| 02 Nov | 10:30 AM – 11:30 AM | Ms. Rachna | 01 Seat |
| 09 Nov | 12:00 PM – 01:00 PM | Mr. Abhi | 02 Seats |
| 16 Nov | 07:30 PM – 08:30 PM | Mr. Rahul | 01 Seat |
| Date | Time | Trainer | Seats Left |
|---|---|---|---|
| 28 Nov | 03:00 PM – 05:00 PM | Mr. Irshad | 02 Seats |
Seats are limited and updated daily. All timings are in IST.
Nine modules and 120-plus hours follow the toy train's route: board at Siliguri (collect data), clear the line (clean), climb through the zig-zags (analyse), circle the loops (interpret), reach the viewpoint (visualise) and describe the panorama to those below (present). Each module ends with a practical test on real data; module nine completes your portfolio.
| Module | Topic | Hours | Tools |
|---|---|---|---|
| 1 | Excel for Data Analytics | 12 | Excel, Power Query |
| 2 | SQL & Database Management | 18 | MySQL |
| 3 | Python for Data Analytics | 20 | Python, Pandas, NumPy |
| 4 | Statistics & Business Mathematics | 12 | Excel, Python |
| 5 | Data Cleaning & EDA | 12 | Python, Pandas |
| 6 | Power BI | 18 | Power BI Desktop |
| 7 | Tableau | 10 | Tableau Public |
| 8 | AI & Gen AI for Analysts | 8 | ChatGPT, Copilot |
| 9 | Capstone & Career Prep | 10 | All tools |
| Total | 120 Hours | 10+ tools |
Irshad Khan — Senior Trainer, 8+ Years Experience. Specialization: Data Science, Data Analytics, Business Analyst, SQL, Power BI, Python, Generative AI, Agentic AI.
Once the nine modules, assignments and capstone are done, a Siliguri learner gets the Uncodemy Data Analytics Program Certificate. Printed on it: the programme title, months of study, tools practised, date of completion and a code proving it's genuine.
A ticket proves you boarded; the photo from the top proves you arrived. Recruiters want that photo — your graded Excel, SQL, Python, statistics, BI and Gen AI work and a capstone you completed alone — with the certificate as your ticket stub.
Tea companies, transporters, hotels and hiring managers anywhere can authenticate a Siliguri learner's certificate on Uncodemy's portal.
Uncodemy Certificate Verification — Online Certificate Verification & Download: certificate.uncodemy.com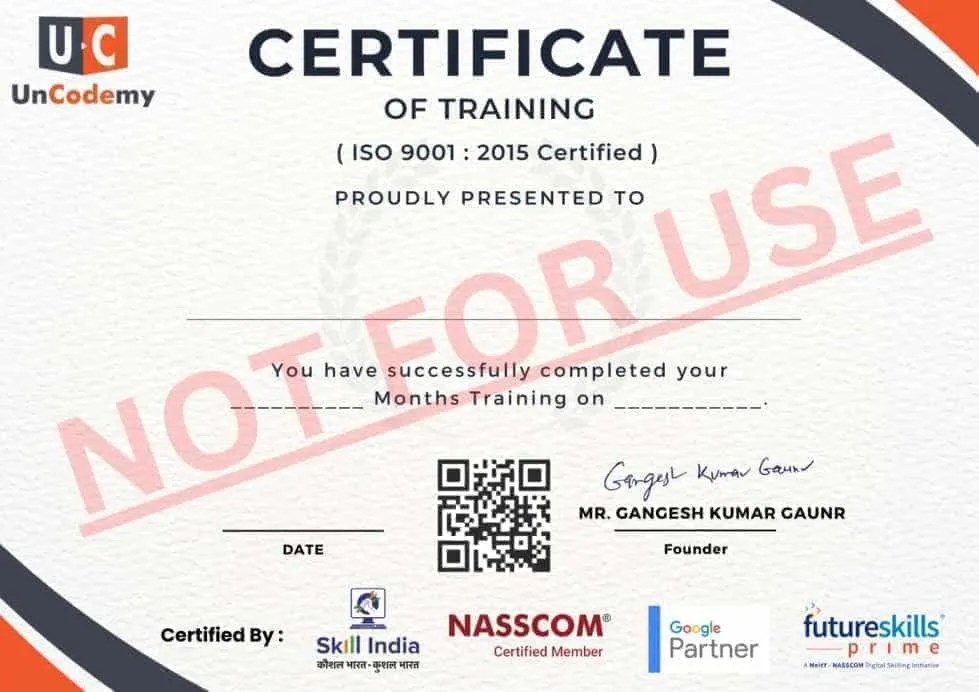
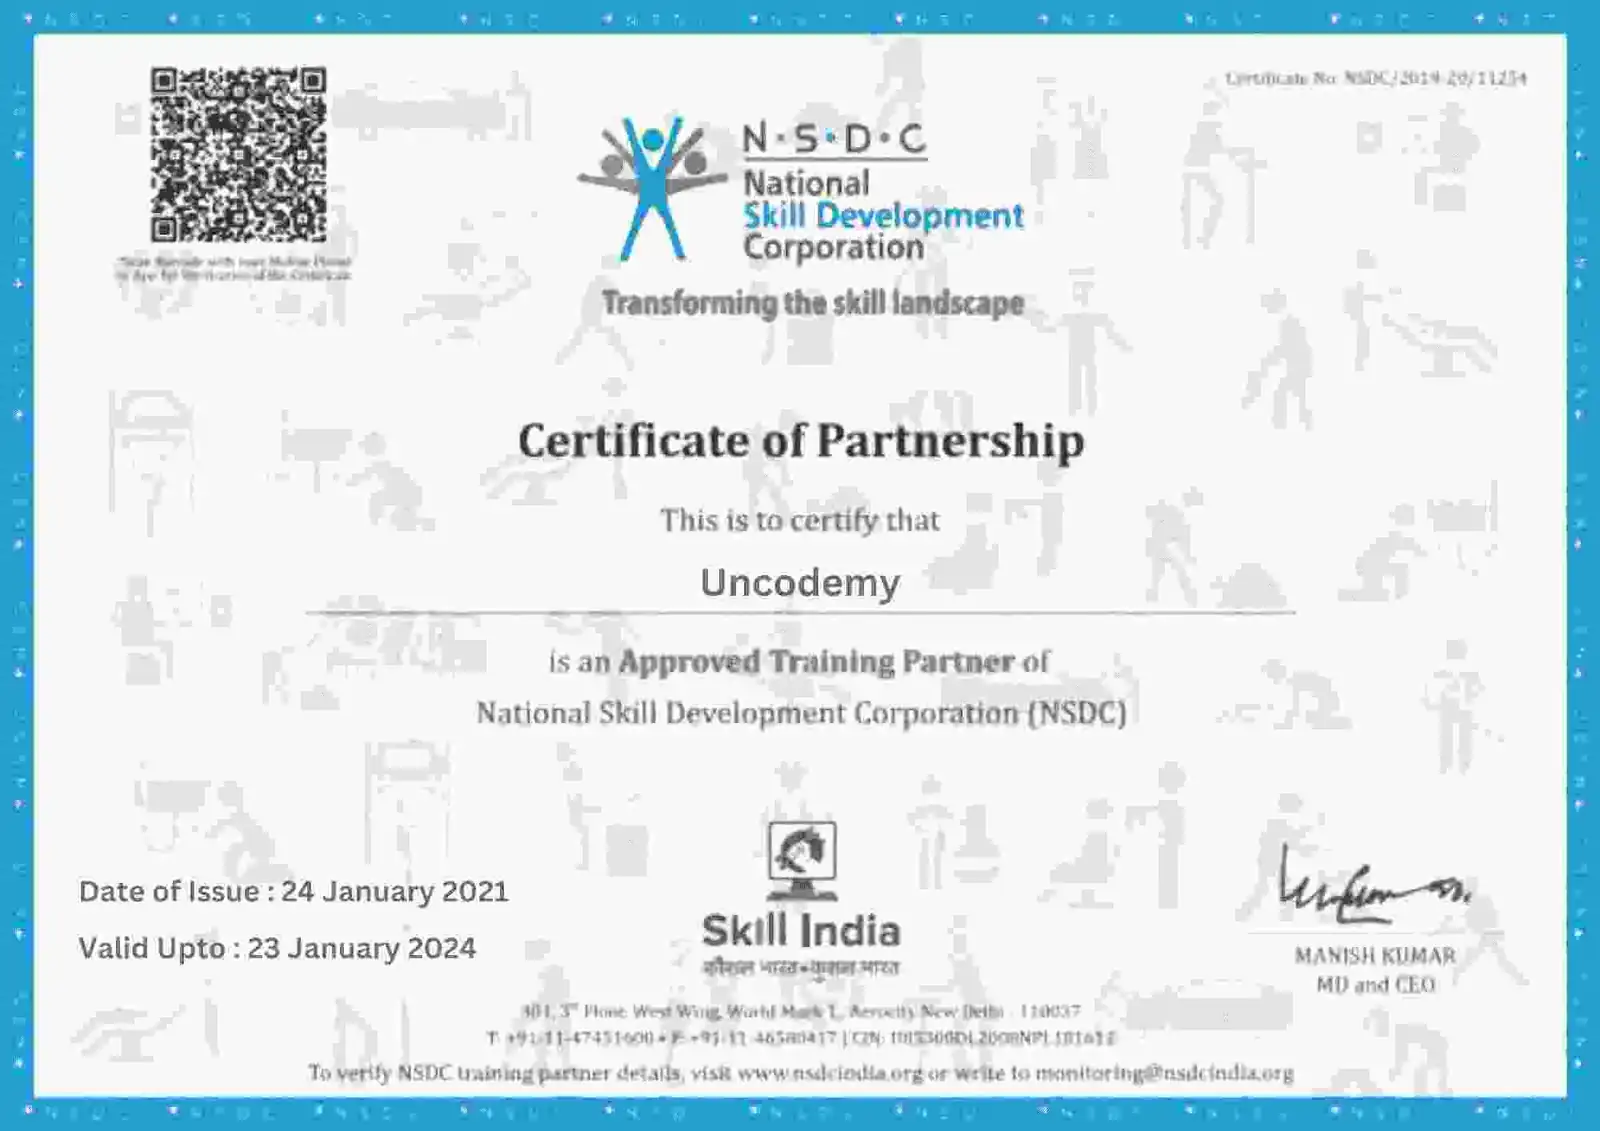

Uncodemy is run by Uncodemy Edutech Pvt. Ltd., and every route it designs ends at the same station: a job for the learner. Classroom batches are in Delhi and Noida; online batches deliver the same live lessons to Siliguri and beyond.
The course applies Excel, SQL, Python, statistics, Power BI, Tableau and Gen AI to real datasets — tasks resembling what analysts do for North Bengal's tea estates, transport firms, wholesalers and hotels. The full syllabus can be inspected before you sign up.
Live classes come with mentor hours, marked practice, project reviews, mock interviews and job alerts. Uncodemy provides its career support policy in writing before payment, laying out coverage, limits and eligibility.
Siliguri learners whose interest lies in machine learning, AI, data science or business analysis will find each available as its own live online Uncodemy programme.
Board from Siliguri — join live classes, practise on tea, transport and tourism data, build a portfolio and prepare for analyst roles in North Bengal, Kolkata, the North-East or remote teams.
North Bengal's tea belt — the Terai around Siliguri, the Dooars and the Darjeeling hills — includes hundreds of estates and a fast-growing small-grower sector. The Siliguri Tea Auction Centre, bought-leaf factories, brokers and packers track leaf intake, made-tea output, grades, auction prices and dispatch, all of which reward careful analysis.
Siliguri's location makes it a logistics and trading hub. Goods bound for the North-East, Sikkim, Nepal, Bhutan and Bangladesh pass through its transport yards, warehouses and wholesale markets such as the Regulated Market and Bidhan Market. Trucking firms, clearing agents, FMCG distributors and e-commerce fulfilment centres all manage large operational datasets.
Tourism thrives: Darjeeling, Kalimpong, Mirik, Gangtok and the Dooars wildlife parks draw millions, and Siliguri, with Bagdogra airport and New Jalpaiguri station, is their gateway. Hotels, homestays, travel agents and taxi operators handle booking and seasonal data. North Bengal Medical College and growing private hospitals, along with the University of North Bengal and engineering colleges, add healthcare and education roles.
Kolkata is about 560 km away and Guwahati around 450 km, while remote analytics jobs open opportunities nationwide. Employers expect SQL and a BI tool; what makes a candidate stand out is clear problem framing and a recommendation that's practical to act on.
Typical first titles in Siliguri: Data Analyst, Business Analyst, MIS Executive/Analyst, BI Analyst, Marketing/Product Analyst or Operations Analyst. A Dooars estate wants leaf-intake and grade boards, a Sevoke Road transporter wants route-margin views, and a hill-station hotel group wants season-by-season booking sheets — SQL, spreadsheets and a BI tool make all three.
| Role | Core Tools |
|---|---|
| Data Analyst | SQL, Excel, Python, Power BI |
| Business Analyst | SQL, Excel, BI tools |
| MIS Executive / Analyst | Excel, SQL, Power BI |
| Business Intelligence Analyst | Power BI, Tableau, SQL, DAX |
| Marketing / Product Analyst | SQL, Python, BI tools |
| Operations Analyst | Excel, SQL, Power BI |
In the Terai and Dooars, an opening post as Data, MIS or Business Analyst usually leads within two to four years to BI, corridor logistics, tea-commodity or hill-tourism revenue analytics — handed to people whose figures prove reliable season after season.
Pay depends on experience, industry and the SQL and BI skills you can demonstrate; the same title may pay very differently. Basic reports earn the entry rate; well-structured queries, sharp framing and convincing recommendations earn more and faster growth.
| Career Level / Role | Indicative Salary Range |
|---|---|
| Entry-Level Data Analyst | ₹3–6 LPA |
| Data Analyst (Mid-Level) | ₹6–10 LPA |
| Senior Data Analyst | ₹10–15 LPA |
| Business Intelligence Analyst | ₹7–12 LPA |
Sources reviewed: AmbitionBox, Glassdoor, Indeed and Uncodemy placement records. Reviewed: 12 October 2026.
Big tea groups, corridor logistics companies and private hospitals tend to sit mid-band, small wholesalers may open lower, and Kolkata, Bengaluru or remote teams can pay above. Read every range as indicative — Uncodemy promises neither the job nor the package.
Uncodemy's hiring network covers more than 850 companies across India. Around Siliguri, analysts find roles in:
Tea — estate, bought-leaf factory, auction and packer analytics
Logistics and wholesale — route, warehouse and distribution data for the North-East corridor
Tourism and hospitality — Darjeeling, Sikkim and Dooars bookings and seasonality
Healthcare, education and banking — patient, admissions and customer reporting
Remote teams and Kolkata or Guwahati offices — seats you can fill without leaving the Terai
Tea, logistics and tourism employers each value different strengths, so choose your line early and build your portfolio along it.
Becoming an analyst is like the toy train's climb: you gain height in stages, sometimes reversing at a zig-zag to consolidate before climbing again. Try to take the slope head-on — skipping fundamentals — and you'll slip back, usually in a technical interview or your first month at work.
Siliguri Junction, Excel — XLOOKUP, PivotTables and Power Query, practised until weekly trip or leaf-intake tallies assemble almost by themselves.
Sukna, SQL — joins across trips, loads and invoices, grouped totals, subqueries and window functions.
The zig-zags at Rongtong, Python — Pandas and NumPy for large fleet or leaf-intake logs and automated reports.
Tindharia workshops, statistics — sampling, significance tests and regression to keep your conclusions on the rails.
Batasia Loop, Power BI or Tableau — DAX measures or calculated fields on a page clean enough for an estate manager to read between meetings.
Arriving at Ghum, your Siliguri portfolio — three to five finished pieces (route margins, grade-wise auction prices, homestay occupancy by month), each ending in a recommendation.
Kanchenjunga at sunrise, interviews — solve SQL puzzles under time pressure, rehearse business cases aloud, and rewrite your CV so each project reports a concrete outcome.
Allow around six to seven months of steady gradient; by then most Siliguri learners reach interviews feeling sure-footed.
Siliguri learners can choose among local institutes, Kolkata classrooms and national online bootcamps. This table sets out exactly what Uncodemy's course delivers.
| Factor | This Program |
|---|---|
| Duration | 6–7 months |
| Learning hours | 120+ hours |
| Tools covered | 10+ tools |
| Gen AI module | Dedicated 8-hour module |
| Projects | 5 guided + 1 capstone |
| Career support | Resume, LinkedIn, mock interviews, hiring network |
That spread mirrors what hiring managers want from freshers today — Excel tidying, SQL querying, Python automation and dashboard storytelling, all in one profile. Pre-recorded courses are cheaper, and a wholesale counter that needs only neater Excel and Power BI sheets may be content with one.
Syllabus, trainers, projects and fee are identical across formats. For Siliguri, live online classes are the natural route — learn at home, clear doubts on the spot and fit study around tea seasons, transport schedules or college.
Uncodemy's classrooms are about 1,400 km west, so hybrid attendance isn't realistic from North Bengal. Online learners receive every benefit — live classes, recordings, doubt sessions and placement support — and an approved mode change keeps all progress.
| If you want... | Recommend |
|---|---|
| Only Excel + Power BI basics | A shorter course may be sufficient |
| Full analyst career transition | This program |
| Heavy ML/Data Science | Choose Data Science |
| Business-focused analytics | Consider Business Analytics |
| Self-paced learning | Recorded course |
Who you will learn from in Siliguri. Live sessions for Siliguri are delivered online by the Delhi–Noida faculty. Irshad Khan, Senior Trainer for Data Analytics, leads the batch and approved the syllabus on this page, while Upendra Kumar Tiwari reviews its technical accuracy as a separate domain reviewer.
Learners from Siliguri, the Dooars & the Darjeeling Hills often work with tea gardens, logistics and transit trade and hill tourism records, so mentors encourage projects drawn from those sectors — sales registers, stock sheets, booking logs — giving your portfolio something local employers recognise, alongside NCR and remote teams.
Names, domains and LinkedIn profiles of every trainer are public on the Uncodemy trainers page.

Data Analytics & AI Trainer
Expertise8+ years across consulting and public-sector analytics, with deep hands-on work in AI and MLOps delivery.
Built an OCR model, a disease-prediction model, and a fraud-control model deployed across every Indian state under the Ministry of Health & Welfare.

Data Analytics & AI Trainer
Expertise7+ years turning aviation and enterprise data into forecasting models, dashboards and AI assistants.
AI agent chat/voice bot, AI-driven data analysis, a sales-forecasting ML model, NPS data model evaluation, and a face-recognition model for biometrics.

Data Analytics Trainer
Expertise5+ years in logistics and consumer-brand analytics, with a strong focus on time series, NLP and applied automation.
Speech-to-text using core NLP (T2S), talent acquisition research, and product launch & CMS work on keventers.com using Sparktech.
Data Analytics Trainer
ExpertiseTrainer for the analytics and business intelligence track at Uncodemy, working with learners on Excel, SQL and BI tooling from first principles to interview-ready projects.
Guides classroom capstones on sales and customer dashboards, KPI reporting and end-to-end data cleaning workflows.

Data Analytics Trainer
Expertise3+ years building generative AI and machine learning systems, now Senior Gen AI Engineer at Uncodemy, with deep work in RAG, knowledge graphs, data analysis and AWS.
NEMI, an enterprise memory system built on RAG, knowledge graphs and vector databases, plus automated web-scraping bots and generative AI chatbots and predictive analytics for startups.

Data Analytics Trainer
Expertise14+ years in banking and insurance operations at Aon Hewitt, NIIT Technologies and Coforge, now teaching Excel, SQL, Python and Power BI through real business scenarios.
MIS reports and Excel dashboards for leadership tracking SLAs, error rates and backlog, SQL data cleaning and validation across systems, and live Power BI dashboards.
Data Analytics Trainer
Expertise5+ years across roles at Concentrix, Amazon and Tech Mahindra. A certified Data Scientist who now teaches data science and analytics as Academic Faculty at Uncodemy.
Credit risk management analytics at Tech Mahindra, business communications analytics, and chatbot solutions built with prompt engineering and machine learning.
Senior Data Science Trainer
Expertise15+ years of industry experience building production machine learning systems for retail, telecom and consulting teams.
Modelling security breaches in iOS apps, dormant customer prediction and factor analysis, last-mile delivery optimisation, and credit card fraud detection.

MD & CEO
ExpertiseFounder, MD & CEO of Uncodemy and GS Net Academy, with experience in education, technology leadership, research, mentorship and career development.
Leads strategic direction, academic initiatives, technology-driven education programs and mentorship across Uncodemy and GS Net Academy.
CEO & Founder
ExpertiseCEO & Founder of GvCloud Secure and Uncodemy with 14+ years of professional experience building scalable web, mobile and AI-driven solutions for clients across India, USA, UK, Canada, Australia and Singapore.
Leads technology strategy, scalable web and mobile solutions, AI-driven products and EdTech initiatives across Uncodemy and GvCloud Secure.
A climb of six to seven months: 75-plus live online classes and over 120 learning hours, with a weekday or weekend batch for Siliguri learners.
No coding knowledge is assumed. Tea-estate clerks, transport accountants and North Bengal University BA graduates type their first SQL SELECT and Python variable during class; the opening two months stay mostly with Excel and SQL.
Roughly ten tools: SQL and Python (with Pandas and NumPy) to wrangle data; Statistics to judge it; Excel, Power BI and Tableau to present it; and ChatGPT and Copilot to lighten routine tasks.
Module 8 devotes eight hours to Gen AI — explaining a data task to an assistant, scrutinising the SQL or Python it writes, using Copilot inside Excel and Power BI, and catching confident errors.
Six projects: five guided builds on retail, banking, HR, e-commerce and healthcare data, then a capstone of your choosing. Route-profitability or tea-auction data would make a memorable Siliguri capstone.
Yes — all 75-plus sessions happen in real time and are recorded for replay. Every format follows the same syllabus.
The fee for a Siliguri learner is ₹17,500 plus 18% GST, adding up to ₹20,650; EMIs can begin from ₹4,032 a month.
EMIs start at ₹4,032 per month. The lending partner fixes the tenure and decides approval, while a counsellor handles the forms alongside you.
Yes — sit in on a free online demo from Siliguri, meet the trainer and examine the syllabus before paying.
You'll receive CV and LinkedIn input, portfolio critique, rehearsal interviews and openings from 850-plus partner organisations. Hiring decisions belong to employers, so no job is guaranteed.
Who hires freshers here? Tea groups and auction brokers, corridor transporters and FMCG distributors, hill hotels, hospitals and remote analytics teams — provided you bring SQL, a dashboard tool and complete projects. Entry pay commonly lands between ₹3 and 6 LPA.
A broad guide: ₹3–6 LPA at entry, ₹6–10 LPA after a few years, ₹10–15 LPA at senior level. North Bengal posts may pay below Kolkata or metro equivalents; treat the numbers as indicative only.
Freshers mostly enter as Data, MIS or Business Analysts; logistics, tea-commodity, BI or tourism-revenue analytics are frequent next stops.
Yes — graduates of any discipline can join; a BCom or BA from a North Bengal college counts just as much as engineering.
Ballpark figures only — drawn from Uncodemy records and public review platforms; individual results and EMI terms may differ.
The closest Uncodemy classroom to Siliguri is about 1,400 km away at Shakarpur Extension in Delhi (near Nirman Vihar Metro); the other is in Noida. Learners across North Bengal and Sikkim therefore study through the live online batches.
850-plus organisations hire through Uncodemy, Genpact, Clarivate, HSBC, upGrad and Fiserv among them. From earlier batches: Business Analysts at HSBC and Fiserv, a Genpact Process Developer Analyst and a Clarivate IP Analyst.
Real projects from past batches — open the code on GitHub, see who mentored it, then try the Siliguri version on each card using data from Siliguri, the Dooars & the Darjeeling Hills.
 UncodemyDATA ANALYTICS
A store chain's tangled billing export is straightened out in SQL Server and laid onto a Power BI board that sets branches, months and product groups side by side.
Siliguri version: Run the same SQL Server + Power BI pipeline on tea gardens sales from Siliguri and compare months, products and outlets.
 Python
 Excel
 Power BI
 SQL
 Ms. Rachna VermaData Analytics Trainer
 Sagar Bajirao ShembadeData AnalystUncodemyDATA ANALYST
In PgAdmin4, learners map out the PostgreSQL tables of an online record shop, then query them to see which genres sell best and which listeners return.
Siliguri version: Model a hill tourism catalogue the same way and rank items, customers and areas of Siliguri, the Dooars & the Darjeeling Hills by revenue.
Power BI DAX
 CSV
 GitHub
 Dr. Vijay K. GuptaMD & CEO
 Ankit SinghData AnalystUncodemyDATA ANALYTICS
Covid-19 figures for India are patched in Pandas, scaled into per-lakh rates with NumPy and charted region by region using Matplotlib.
Siliguri version: Clean and chart public health or footfall data for Siliguri, the Dooars & the Darjeeling Hills with the same Pandas and Matplotlib workflow.
Python Pandas
 Jupyter NotebookGitHub
 Mr. Upendra Kumar TiwariSenior Data Science Trainer
 Shruti SaxenaData AnalystUncodemyDATA ANALYTICS
Python, SQL and Power BI combine into a monthly trips, load-factor and route-margin report for a fictional Siliguri transport company.
Siliguri version: Build a scorecard of logistics and transit trade employers around Siliguri — size, hiring trend and pay bands — with SQL and DAX.
PythonSQLPower BIDAXMs. Rachna VermaData Analytics Trainer Rajat KashyapData AnalystUncodemyDATA ANALYTICS
Python | Jupyter Notebook | Power BI | SQL | Mr. Upendra Kumar Tiwari – Senior Data Science Trainer | Pawan Mehra – Data Analyst
Siliguri version: Swap IPL data for tea gardens seasonality in Siliguri and show peaks, slumps and outliers in one dashboard.
PythonJupyter NotebookPower BISQLMr. Upendra Kumar TiwariSenior Data Science Trainer Pawan MehraData Analyst