#1 India's Top IT Training Institute
×

About Uncodemy

Know more about who we are and what we stand for.

About Us

About Us

Discover our mission to equip individuals with essential IT skills and industry expertise.

Read More →
UnCodeMy Gallery

UnCodeMy Gallery

Explore highlights from our IT training sessions and success stories.

Read More →
Mentors

Mentors

Meet the industry experts who train and guide you through your course.

Read More →
Free Resources

Free Resources

Free tutorials, interview questions, tools and calculators to help you learn.

Explore →
×

Free Resources

Learn, practice and plan your career — bilkul free.

Tutorials

Tutorials

Step-by-step written tutorials to learn any technology at your own pace.

Read More →
Free Counselling

Free Counselling

Book a free video counselling session and pick the right course for you.

Read More →
Online Compiler

Online Compiler

Write, run and test your code online — no setup required.

Read More →
Speciality
Prof_Trained

15000+ Professionals Trained

Batch-every

3+ Batches every month

Prof_Trained

50+ Industry expert trainers

Corporate

2500+ Corporate Served

Curriculums for Tableau Training Course in Ghaziabad

Tableau Curriculum

The curriculum has been designed by faculty from IITs, and Expert Industry Professionals.

time
30+

Hours of Content

live1-removebg-preview
15+

Live Sessions

tools
2+

Tools and Software

Set the Basics Right

Tableau is the domain of study that deals with vast volumes of data using modern tools and techniques to find unseen patterns, derive meaningful information, and make business decisions. For example, finance companies can use a customer's banking and bill-paying history to assess creditworthiness and loan risk.

Tableau course provider of Ghaziabad called Uncodemy offers a curriculum that contains following courses to strengthen your skill in Tableau-

Tableau

  • Introduction to Data Visualization
  • Tableau Introduction and Tableau Architecture
  • Exploring Data using Tableau
  • Working with Data using Tableau including Data Extraction and
  • Blending
  • Various Charts in Tableau(Basics to Advanced)
  • Sorting-Quick Sort, Sort from Axis, Legends, Axis, Sort by Fields
  • Filtering- Dimension Filters, Measure Filters, Date Filters, Tableau
  • Context Filters
  • Groups , Sets and Combined Sets
  • Reference Lines, Bands and Distribution
  • Parameters, Dynamic Parameters and Actions
  • Forecasting-Exponential Smoothening Techniques
  • Clustering
  • Calculated Fields in Tableau, Quick Tables
  • Tableau Mapping Features
  • Tableau Dashboards, Dashboards Action and Stories
  • Get cosmopolitan certifications with Uncodemy

    Uncodemy's collaborations with respected industry partners enable the institute to offer students an exceptional opportunity to learn from some of the most distinguished trainers in the Tableau field. Uncodemy awards an Uncodemy Certificate, an Uncodemy Agile Certificate and a Module Completion Certificate on completing the course.

    Tools and Technologies covered
    • imageexcelExcel
    • imagetablueTableau
    • Power-BI-SymbolPower-Bi
    • imageggplotggplot
    • imagejupitorJupyter
    • imagenumpyNumpy
    • imagepythonPython
    • imagepandasPandas
    • imageseabornSeaborn
    • imagelockerLooker
    • Matplotlib-logoMatplotlib
    • imagepycharmPyCharm
    • imagegoogleColabGoogle Colab
    • imageanacondaAnaconda
    • imagenltkNLTK
    • imagescikitlernScikit-learn
    • imagesqlSQL
    • imageMySqlMySql
    • imagepostgersqlPostgreSQL
    • imagemlML
    • imagedeeplDeep Learning
    • imagenlpNLP
    How Uncodemy Helps Every Student Acing Their Interview-

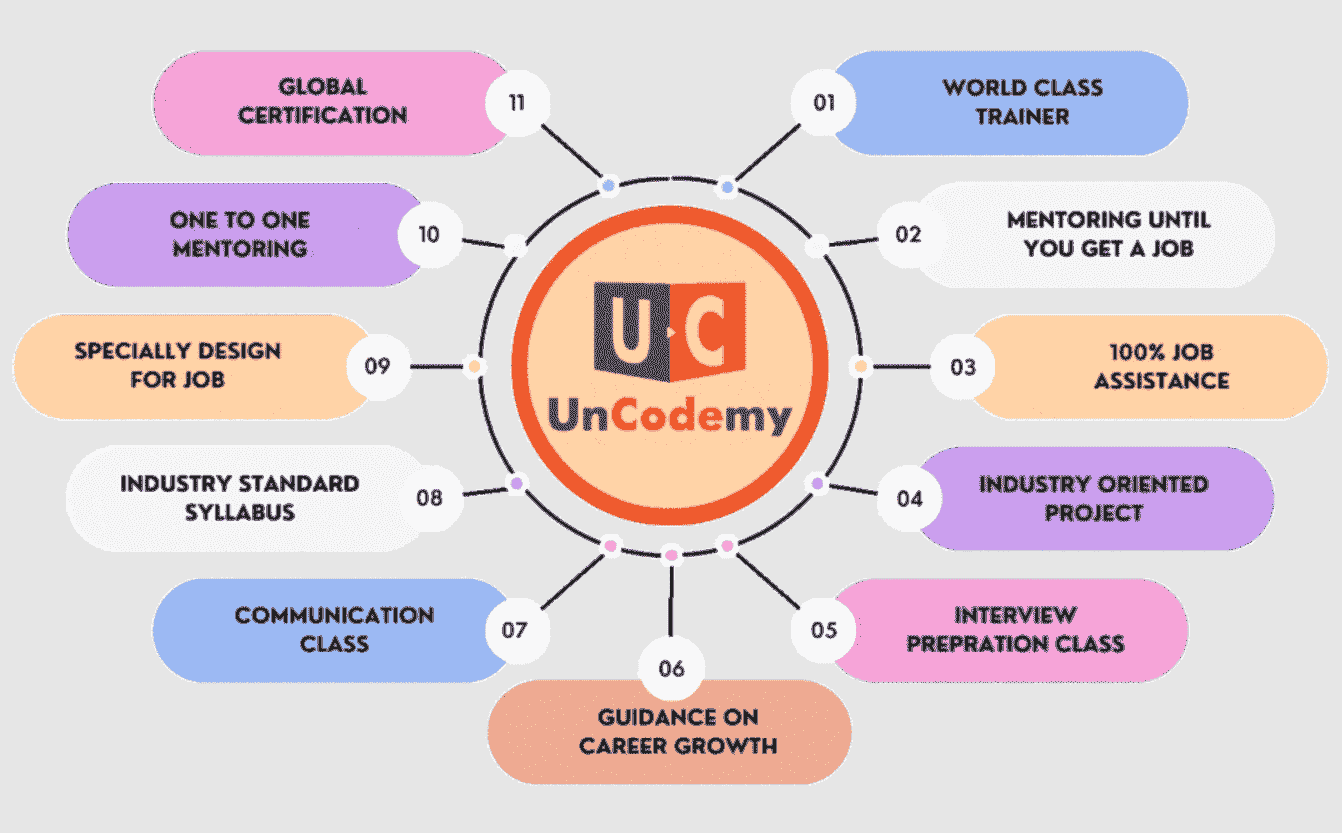
    In addition to exceptional Tableau training in Ghaziabad, Uncodemy supports students in their job search by offering :

    animate
    Uncodemy

    Access unparalleled learning with live sessions, recordings, assignments, and live projects led by a top-tier mentor and industry expert trainer. Elevate your skills with the best-in-class educational content.

    Young-male-holding-laptop-408w
    Uncodemy

    We Provide EMI Facility for You

    Nothing Stops you from Learning

    Young-male-holding-laptop-408w

    Become a Tableau Expert - Talk to Expert Counselor

    Awards
    c3
    c4
    Ghaziabad guide

    Seeing routes, stores and demand with Tableau in Ghaziabad

    Ghaziabad sits where several freight corridors meet — the Delhi–Meerut Expressway, NH-9 and the Eastern Peripheral Expressway — and that has filled its edges with warehouses, transporters and distribution hubs. At the same time, Indirapuram, Vaishali, Raj Nagar Extension and Crossings Republik have grown into dense residential markets served by supermarket, pharmacy and quick-commerce outlets. Both kinds of business have a geography problem: where are orders, stores and delays? Tableau's mapping, clustering and forecasting topics are a natural fit, and this page approaches the course from that angle.

    Location data

    Why location matters in Ghaziabad data

    In logistics and retail, the same total can hide very different stories depending on where it happens. Typical questions teams here ask:

    • Which pin codes have the most failed or late deliveries, and is it the area, the vehicle or the time slot?
    • Which stores under-perform once you account for the size of the catchment around them?
    • Where should the next dark store or pickup point go, given where orders already come from?
    Read moreRead less

    Answering these with a pivot table is painful; answering them on a map with a filter and a tooltip takes minutes. Tableau can geocode Indian states and many districts out of the box; for pin-code or locality level you usually add latitude and longitude to your data, which is a good exercise in data preparation in itself.

    Three techniques

    Syllabus topics that do the heavy lifting

    Mapping

    Symbol and filled maps of orders, stores or delays; dual-axis maps to compare two measures in one view.

    Clustering

    Group stores or delivery zones by behaviour — basket size, order frequency, return rate — to see which ones really resemble each other.

    Forecasting

    Exponential smoothing for weekly order volumes, useful for staffing a warehouse before festival peaks.

    Read moreRead less

    Around these, the course covers the groundwork: connecting and blending data, groups and sets (for example, a set of "priority customers"), calculated fields, and dashboards with actions. Forecasts and clusters from Tableau are a starting point for discussion, not an operations plan — say so when you present them.

    Who joins

    People who take Tableau from Ghaziabad

    • Logistics and supply-chain executives at transporters, 3PL warehouses and distribution hubs, who already track shipments in spreadsheets.
    • Retail and category staff working for chains with outlets across Ghaziabad and east Delhi.
    • Commuters to Noida offices in e-commerce operations, customer support or sales ops roles who want to move into analytics.
    Read moreRead less

    Students also join — engineering and management students from colleges in the city and along NH-58 — usually alongside a broader data-analytics or SQL course. For them, a well-built map-based project is a good way to stand out from peers whose portfolios all use the same sample dataset.

    Attend

    Classroom or online: options for Ghaziabad

    There is no Uncodemy centre in Ghaziabad. Classroom batches are held at Noida (Sector 1) and Delhi (Shakarpur Extension, Laxmi Nagar). Learners on the Vaishali–Kaushambi side reach Laxmi Nagar quickly on the Blue Line; those near the Red Line or in Raj Nagar Extension often prefer the Noida centre by road, or study online. Live online batches are the choice for most warehouse and retail staff, whose working hours rarely end on time.

    • Durationabout a month
    • Content30+ hours of content
    • Live classes15+ live sessions
    • Fee₹8000
    • EMIEMI options available (ask the counsellor for the monthly plan)
    Read moreRead less

    Whichever you pick, you cover 1 curriculum block (Analyzing and Visualizing Data using Tableau) and practise in Tableau Desktop, Tableau Prep Builder and Tableau Server/Tableau Online. The course costs ₹8000. Book a free demo session first if you want to see a live session before committing.

    Project

    Portfolio project: a last-mile delivery dashboard

    1. Data: invent three months of orders for a delivery hub — order ID, promised and actual delivery time, locality, pin code, latitude/longitude, rider and order value.
    2. Map view: late-delivery rate by locality, sized by order count.
    3. Trend view: on-time % by week with a reference line at the target, plus a forecast for the next four weeks.
    4. Cluster view: group localities by order volume, value and late rate.
    5. Dashboard: click a locality on the map to filter the trend and rider table.
    Read moreRead less

    Write two or three plain-language findings on the dashboard itself. Interviewers care less about the chart and more about whether you can say what a manager should do next. Related practice: charts and visuals questions and scenario-based questions.

    Pay

    Indicative pay for Tableau-related roles

    RoleTypical settingIndicative range
    Logistics / MIS executiveTransporter, 3PL, distributor in Ghaziabad₹2.2–4 LPA
    Supply-chain or retail analystRetail chain, e-commerce operations₹3.5–6.5 LPA
    Tableau / BI analyst, 2–4 yearsNoida or Delhi analytics teams₹5.5–10 LPA
    Read moreRead less

    Indicative ranges from the broad NCR market, not Uncodemy placement figures. Actual offers vary by company, role and interview.

    Data cleaning

    The messy part: addresses and locality names

    Before any map works, you will spend time on location data. In Ghaziabad the same place may appear as "Indirapuram", "Indra Puram" or "Ahinsa Khand 2", and pin codes are often missing or wrong in manually entered orders.

    Read moreRead less
    • Keep a locality mapping table that standardises spellings and attaches the right pin code and coordinates.
    • Use groups in Tableau for quick fixes, but correct the source data where you can.
    • Flag records you could not locate instead of silently dropping them — and show how many there were.

    Being able to explain this clean-up in an interview shows real-world experience more convincingly than any chart.

    Explore

    More for Ghaziabad learners

    Other data and reporting courses for Ghaziabad learners

    Tableau course in nearby cities

    Frequently Asked Questions

    No, there is no Ghaziabad centre. Classes are held at Noida (Sector 1) and Delhi (Shakarpur Extension, Laxmi Nagar), and the same course runs live online for Ghaziabad learners.

    ₹8000, identical for every city. EMI: EMI options available (ask the counsellor for the monthly plan).

    It lasts about a month: 30+ hours of content, 15+ live sessions and 1 curriculum block (Analyzing and Visualizing Data using Tableau), practised in Tableau Desktop, Tableau Prep Builder and Tableau Server/Tableau Online.

    Tableau recognises Indian states and many districts. For pin-code or locality maps, the reliable method is adding latitude and longitude to your data, which the project on this page practises.

    Yes, if you choose a live online batch at a time that suits your shift and practise a little on off days. The course is short, but regular practice matters more than total hours.

    Local SMEs and distributors lean towards Excel and Power BI; e-commerce, retail-chain and analytics teams in Noida and Delhi use Tableau more often. Read the job descriptions you are targeting.

    No coding experience is needed to enrol; basic computer skills are enough, and calculated fields are taught step by step.

    No. Uncodemy provides resume reviews, mock interviews and job-application support (placement assistance, not a job guarantee). Your interviews decide the outcome.

    Become a Tableau Expert - Talk to Expert Counselor