






Data and AI project · Intermediate · 4–8 weeks
AI Sales Forecasting Copilot Project: Forecasts, Backtesting and Grounded AI Answers
Forecast monthly sales you can actually explain — and ask questions answered only from your own data.
- React
- TypeScript
- Vite
- Java 17/21
- Spring Boot 3.3
- H2
- PostgreSQL
- Flyway
- 18
- chapters in the guide
- 07
- steps to run it
- 50
- files in the ZIP
Tested 18 Nov 2026Automated tests: 5 passed
Free ZIP, 0.09 MB50 files, no keys inside
ai-sales-forecasting-copilot-project-source-code.zip0.09 MB · 50 files · clean code, no keys inside · .env.example included
01What you will build and learn
AI Sales Forecasting Copilot is a full-stack data analytics project: a React dashboard and Spring Boot API that turn sales history into KPIs, a moving average + trend forecast checked with MAE and WAPE, what-if scenarios and a copilot that answers only from approved analytics. It runs offline on sample data with no API key, and includes the same forecast in Python/pandas. It suits final-year students and aspiring data analysts.
You will build
- A sales dashboard with total sales, growth rate, top products and top regions
- A Forecast Studio: monthly moving average + trend with chronological backtesting, MAE and WAPE
- A CSV Upload Center that validates every row and reports rejects
- A Scenario Planner that compares a +X% volume uplift with the baseline
- A grounded AI copilot (rule-based offline, OpenAI optional) that never invents numbers
- A Python/pandas script that reproduces the forecast and plots it
Skills you practise
- Time-series aggregation and chronological train/test splits
- Forecast accuracy metrics: MAE and WAPE (and why to avoid MAPE)
- pandas groupby, Period handling and matplotlib charts
- KPI design for sales dashboards
- Designing grounded LLM answers with allow-listed analytics functions
- REST APIs with Spring Boot, Flyway migrations and H2/PostgreSQL
- Data validation for CSV imports
Before you start
- Java 17 or 21 (Temurin from adoptium.net) — Maven is downloaded by the wrapper
- Node.js 18+ and npm
- Basic SQL and spreadsheet-level understanding of sales data
- Optional: Python 3.10+ with pandas for the analysis script
- Optional: Docker (PostgreSQL) and an OpenAI API key (LLM answers)
Live demo in HTML, CSS and JavaScript
02Sales forecast studio — try it in your browser
This is a simplified browser version of the project's Forecast Studio and Copilot. It sums the sample sales CSV by month, backtests a moving average + trend model on the last 3 months (MAE and WAPE), forecasts the next months with a ±8% band and a what-if uplift, and answers a few questions only from the numbers it just computed. Edit the CSV, the horizon or k and press Run forecast.
Result
Edit any tab and press Run. This is a simplified browser version of the project for learning; the full project is in the ZIP.
How the demo works
- parseCsv() reads the CSV text and rejects rows with a bad date or a non-numeric revenue, like the Upload Center.
- totalsBy() sums revenue per month (and per product and region), sorted in time order.
- The last 1–3 months are held out as a test set; maTrend() fits a moving average of the last k months plus the first-to-last slope on the rest.
- Predictions for the test months give MAE (average absolute error) and WAPE (total error ÷ total actuals × 100) — the same numbers the Java API returns.
- The model is refit on all months to forecast the horizon with a ±8% band and a scenario uplift, drawn on a <canvas>.
- ask() is a tiny rule-based copilot: it matches keywords and answers only with computed figures, or says “Insufficient data”.
03Project overview
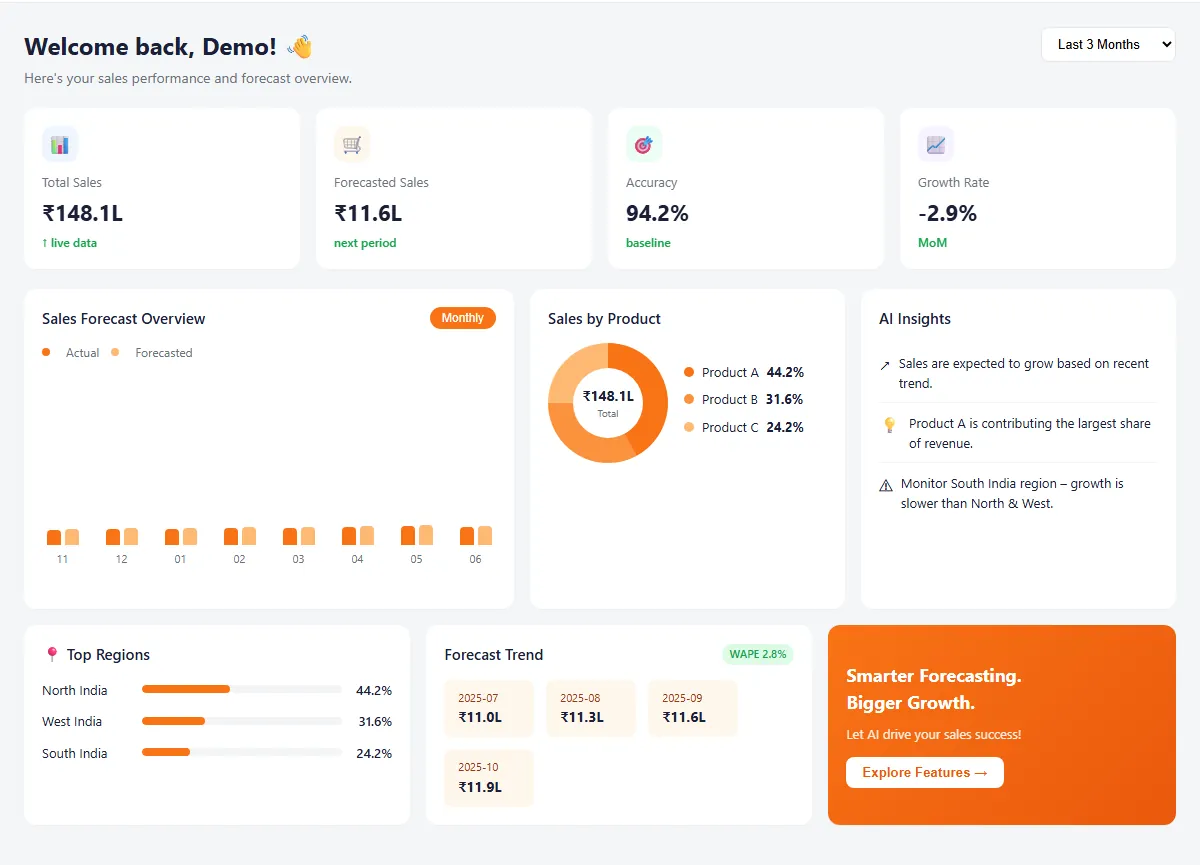
AI Sales Forecasting Copilot helps sales, finance and operations teams understand historical sales, estimate future demand, surface risks and opportunities, and ask natural-language questions — all grounded in real data. It supports decisions. It does not guarantee revenue or replace managerial judgment.
One-line pitch for a senior: “We ingest sales history, validate and aggregate it, generate forecasts with accuracy metrics, visualize actuals versus predictions, flag meaningful trends, and let users ask grounded questions whose answers are based on authorized business data.”
What the working project includes
| Feature | Status | What it means |
|---|---|---|
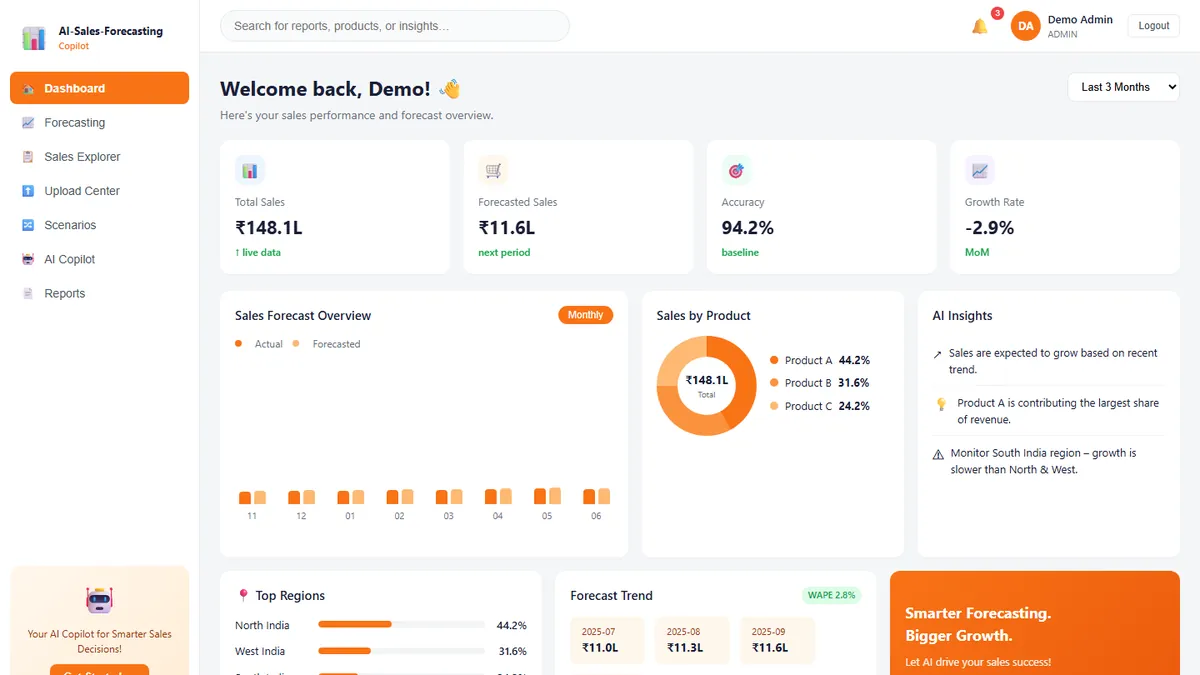
| Dashboard KPIs + charts | Working | Live numbers, trends and visual insights on one screen |
| Forecast Studio (MA + trend, MAE/WAPE) | Working | Create forecasts and see accuracy metrics |
| Chronological backtesting | Working | Test the model on past data the right way (no data leakage) |
| Sales Explorer (filter) | Working | Search and filter historical sales records |
| CSV Upload + validation | Working | Upload new data with automatic row checks |
| Scenario Planner (volume uplift) | Working | Ask “what if sales increase by 10%?” |
| AI Copilot (grounded) | Working | Plain-English questions; answers come only from real data |
| Real LLM when API key set | Optional | Uses OpenAI when a key is provided |
| Rule-based fallback (no key) | Working | Still answers without any external AI key |
| Sample data auto-seed + H2 demo | Working | Runs instantly with demo data |
| Docker Compose for PostgreSQL | Ready | Switch to a production-style database |
04Business problem, users and value
Most sales and finance teams still depend heavily on spreadsheets. Data lives in many places (CRM, ERP, Excel files, emails), reporting is repetitive, different people forecast with different methods so the numbers do not match, and declining demand is often discovered only after it is too late to act. This project brings everything into one clean, consistent and explainable system.
Who uses the application
- Sales manager — reviews trends, checks performance against targets, plans next-period goals.
- Finance / FP&A analyst — compares forecast with budget, explains variance, builds scenarios.
- Leadership — reviews KPIs, risks and opportunities without digging into raw data.
- Analyst / admin — uploads data, maps columns, checks data quality, manages access.
Potential value (realistic, not guaranteed)
- Less manual work — less repetitive spreadsheet and reporting effort.
- Earlier visibility — seasonality, demand shifts and declining products show up sooner.
- Consistent planning — the same numbers and assumptions across teams and regions.
- Traceable forecasts — model, training window and MAE/WAPE recorded for every run.
- Natural language — non-technical users get grounded answers without writing SQL.
Measure a pilot with concrete metrics: reporting time saved, forecast error (MAE/WAPE), user adoption, data quality and decisions supported. Never promise a guaranteed profit uplift.
05Scope: MVP vs later releases
Building everything at once is risky. Build the MVP column first; move to Release 2 only after the core loop (upload → forecast → visualize → ask questions) works smoothly.
| MVP — build first | Release 2 | Advanced / optional |
|---|---|---|
| Login + basic roles | Multi-organization support | SSO / enterprise policies |
| CSV upload + validation | Scheduled imports / ERP connectors | Streaming / real-time data |
| KPI dashboard + filters | Product / region drill-down | Advanced segmentation |
| Baseline forecast + backtesting | Model comparison (ARIMA etc.) | Probabilistic forecasts |
| Forecast chart/table + metrics | Scenario planning / overrides | Optimization / what-if engine |
| Rule-based insights + grounded Q&A | Alerts / saved reports | Agent workflows with approvals |
| Audit logs + CSV export | Email / Slack notifications | Advanced governance and monitoring |
06Architecture and technology stack
- Frontend: React + TypeScript + Vite — fast, type-safe UI.
- Backend: Java 17/21 + Spring Boot 3.3 — REST APIs, validation, security.
- Database: H2 in-memory for the demo, or PostgreSQL, with Flyway migrations.
- Forecast engine: plain Java moving average + simple linear trend, with MAE and WAPE.
- AI layer: the LLM is called only from the backend; without a key a rule engine answers from the same data.
- Deployment: Docker Compose for local PostgreSQL; jar + npm scripts for demos.
Logical flow
Browser (React + TypeScript)
        │  HTTPS / REST + JSON
        ▼
Spring Boot API — Auth / Validation / Audit
  ├── Import & Data Quality ── Database (H2 or PostgreSQL)
  ├── KPI & Analytics ─────── Database
  ├── Forecast module ─────── Forecast tables
  ├── Copilot module ──────── LLM (server-side only) or rule engine
  └── Export / Scenarios
End-to-end workflow
- Open the app
The React frontend talks only to the backend REST APIs.
- Seed demo data
On first start with the
demoprofile,DataLoaderinserts 54 sample sales rows so the app is never empty. - Dashboard
KPIs, revenue trend, top products, top regions and insights load from
/api/v1/dashboard/summaryand the analytics endpoints. - Forecast
Pick a horizon and click Run Forecast; the backend backtests and returns MAE and WAPE.
- Upload
Upload a CSV; every row is validated and only clean rows are saved.
- Scenario
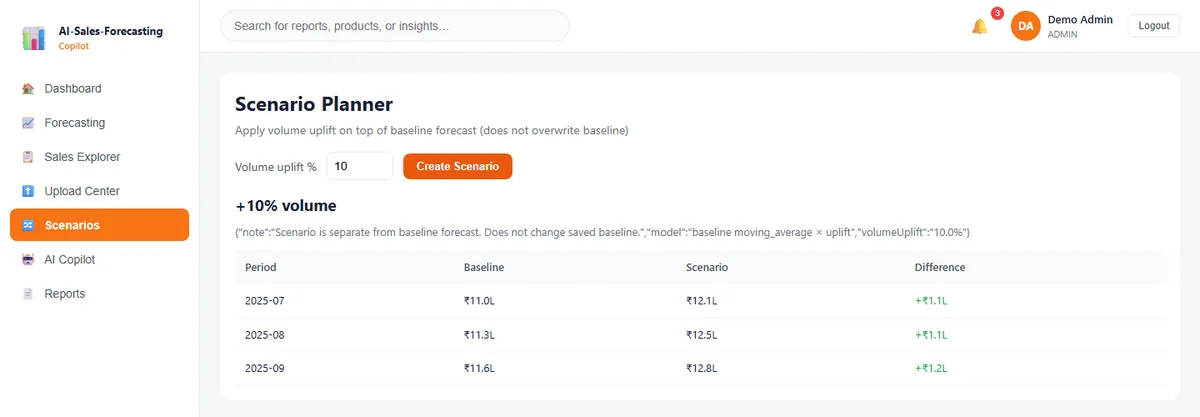
Create a “+10% volume” scenario and compare it with the baseline.
- Ask the copilot
The backend calls only approved analytics functions and returns a grounded answer with numbers.
07Folder structure
The download is cleaned: no node_modules, no target/ build output and no 55 MB prebuilt jars. Two learning extras are added: a Python/pandas version of the forecast and a single-file browser demo.
ai-sales-forecasting-copilot-project/
├── frontend/                     ← React + TypeScript (Vite)
│   ├── src/App.tsx               ← all screens (MVP keeps the UI in one file)
│   ├── src/App.css
│   ├── package.json
│   └── vite.config.ts
├── backend/                      ← Spring Boot
│   ├── .mvn/wrapper/             ← Maven wrapper settings
│   ├── src/main/java/com/example/salescopilot/
│   │   ├── config/               ← Security, CORS, DataLoader (seeds demo data)
│   │   ├── controller/           ← REST API endpoints
│   │   ├── service/              ← AnalyticsService + ForecastService
│   │   ├── copilot/              ← CopilotService + LlmClient
│   │   ├── entity/               ← SalesRecord, User
│   │   └── repository/           ← database access
│   ├── src/main/resources/
│   │   ├── application.yml       ← PostgreSQL profile (default)
│   │   ├── application-demo.yml  ← H2 demo profile
│   │   └── db/migration/         ← Flyway SQL scripts
│   ├── src/test/java/...         ← Spring Boot tests (H2)
│   └── pom.xml
├── analysis/forecast_baseline.py ← same forecast in Python + pandas
├── browser-demo/index.html       ← no-install HTML/CSS/JS demo
├── sample-data/sales_sample.csv  ← ready-to-use demo data (54 rows)
├── docker-compose.yml            ← PostgreSQL setup
├── .env.example
└── README.md08Step 1: Run the project locally
Demo login: admin@demo.com / admin123 (pre-filled on the login screen). No database install and no API key are needed for the demo.
A — Backend (port 8080)
cd ai-sales-forecasting-copilot-project/backend

# macOS / Linux
./mvnw spring-boot:run -Dspring-boot.run.profiles=demo

# Windows (PowerShell or cmd)
mvnw.cmd spring-boot:run "-Dspring-boot.run.profiles=demo"
Wait for Started SalescopilotApplication and Seeded 54 sales records. The first run downloads Maven and the dependencies, so it takes a few minutes.
B — Frontend (port 5173)
cd ai-sales-forecasting-copilot-project/frontend
npm install
npm run dev
Open http://localhost:5173 and click Sign in.
C — Optional: PostgreSQL
docker compose up -d
cd backend
./mvnw spring-boot:run      # default profile uses application.yml (PostgreSQL)
D — Optional: real LLM
export OPENAI_API_KEY=your-key-here     # PowerShell: $env:OPENAI_API_KEY="your-key-here"
# restart the backend — answers now show mode: llm
The demo profile file that makes all this work:
spring:
  datasource:
    url: jdbc:h2:mem:salescopilot;MODE=PostgreSQL;DB_CLOSE_DELAY=-1;DATABASE_TO_LOWER=TRUE
    driver-class-name: org.h2.Driver
  jpa:
    hibernate:
      ddl-auto: none
  flyway:
    enabled: true
server:
  port: 8080
app:
  llm:
    api-key: ${OPENAI_API_KEY:}     # empty = rule-based copilot
    model: gpt-4o-mini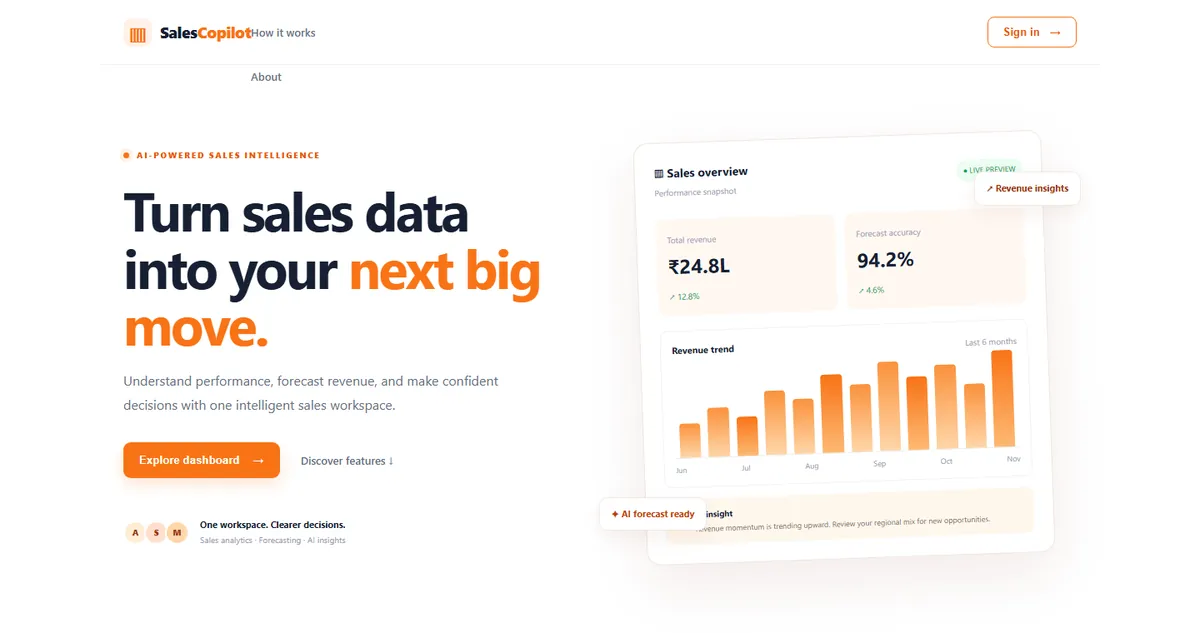
09Step 2: Database design
Flyway creates the schema on the first start from db/migration/V1__init_schema.sql. Core tables:
organizations,roles,users— multi-tenant-ready foundationproducts,sales_records— the actual sales dataimport_jobs— tracks every CSV uploadforecast_runs,forecast_values,forecast_metrics— every forecast, for reproducibilityscenarios— what-if assumptions;audit_events— security and compliance
CREATE TABLE IF NOT EXISTS sales_records (
    id BIGINT GENERATED BY DEFAULT AS IDENTITY PRIMARY KEY,
    organization_id BIGINT NOT NULL,
    sale_date DATE NOT NULL,
    product_name VARCHAR(200),
    region VARCHAR(100),
    quantity DECIMAL(12,2),
    revenue DECIMAL(14,2) NOT NULL,      -- money as DECIMAL, never float
    currency CHAR(3) DEFAULT 'INR',
    order_id VARCHAR(100),
    created_at TIMESTAMP DEFAULT CURRENT_TIMESTAMP
);

CREATE TABLE IF NOT EXISTS forecast_runs (
    id BIGINT GENERATED BY DEFAULT AS IDENTITY PRIMARY KEY,
    organization_id BIGINT NOT NULL,
    target VARCHAR(50) DEFAULT 'revenue',
    grain VARCHAR(20) DEFAULT 'monthly',
    horizon INT DEFAULT 3,
    model_name VARCHAR(50) DEFAULT 'moving_average',
    status VARCHAR(30) DEFAULT 'COMPLETED',
    created_at TIMESTAMP DEFAULT CURRENT_TIMESTAMP
);
-- also: organizations, roles, users, products, import_jobs,
--       forecast_values, forecast_metrics, scenarios, audit_events
Design rules
- Store money as
DECIMAL, never float or double, to avoid rounding errors. - Index
(organization_id, sale_date)and(organization_id, product_id). - Every query filters by
organization_id— the base of tenant isolation. - Demo seed user:
admin@demo.comwith role ADMIN in “Demo Organization”.
10Step 3: REST API contract
All endpoints are versioned under /api/v1.
| Method | Endpoint | Purpose |
|---|---|---|
| GET | /api/v1/health | Health check |
| POST | /api/v1/auth/login | Login |
| GET | /api/v1/dashboard/summary | KPI cards |
| GET | /api/v1/analytics/revenue-trend | Revenue time series |
| GET | /api/v1/analytics/top-products | Top products by revenue |
| GET | /api/v1/analytics/top-regions | Top regions by revenue |
| GET | /api/v1/insights | Rule-based insights |
| POST | /api/v1/forecasts | Create a forecast run |
| GET | /api/v1/forecasts/latest | Latest forecast |
| GET | /api/v1/sales | Search / filter sales |
| POST | /api/v1/imports | Upload a CSV file |
| POST | /api/v1/scenarios | Create a what-if scenario |
| POST | /api/v1/copilot/messages | Grounded Q&A |
Try it with curl (real responses from our run)
curl http://localhost:8080/api/v1/health
# {"status":"UP","service":"AI Sales Forecasting Copilot"}

curl -X POST http://localhost:8080/api/v1/forecasts \
     -H "Content-Type: application/json" -d '{"horizon":3}'
# metrics: {"mae":30000.0,"wape":2.8,"model":"moving_average","trainingPeriods":15,"testPeriods":3}

curl -X POST http://localhost:8080/api/v1/copilot/messages \
     -H "Content-Type: application/json" -d '{"question":"Which region leads?"}'
# {"mode":"rule-based","answer":"Revenue by region:\n- North India: ₹6548000.00 (44.2%) ..."}

curl -X POST http://localhost:8080/api/v1/imports -F "file=@sample-data/sales_sample.csv"
# {"status":"COMPLETED","accepted":54,"rejected":0,"message":"54 rows imported, 0 rejected"}11Step 4: Forecasting maths and workflow
Forecasting is a time-series problem. Define the target (revenue), the time bucket (monthly for the MVP) and any dimensions (product, region).
MVP models
- Moving average — average of the last k periods (k = 3). Stable and easy to explain.
- Simple trend — slope from the first to the last training point, added to the moving average.
Correct workflow (never skip these)
- Aggregate
Sort chronologically and sum revenue by month.
- Split by time
Earlier months are training data; the last months are the test set. Never split randomly.
- Fit and predict
Fit MA + trend on training data only and predict the test months.
- Measure
Compare predictions with the held-out actuals: MAE and WAPE.
- Refit and forecast
Refit on all history and forecast the future horizon (the app adds a ±8% band).
- Save
Store predictions, model metadata, assumptions and limitations.
- MAE = average of |actual − forecast|. Same unit as revenue; lower is better.
- WAPE = sum(|actual − forecast|) ÷ sum(|actual|) × 100. Good for comparing products or regions.
// ForecastService.java (excerpt) — monthly totals, chronological split, MA + trend, MAE / WAPE
int testSize = Math.min(3, values.size() / 3);          // last months = test set
int trainSize = values.size() - testSize;
List<BigDecimal> train = values.subList(0, trainSize);
List<BigDecimal> testActual = values.subList(trainSize, values.size());

int k = Math.min(3, train.size());                      // moving average of last k=3 months
BigDecimal sum = BigDecimal.ZERO;
for (int i = train.size() - k; i < train.size(); i++) sum = sum.add(train.get(i));
BigDecimal ma = sum.divide(new BigDecimal(k), 2, RoundingMode.HALF_UP);

double slope = train.get(train.size() - 1).subtract(train.get(0))   // simple linear trend
        .divide(new BigDecimal(train.size() - 1), 4, RoundingMode.HALF_UP).doubleValue();

BigDecimal absErrorSum = BigDecimal.ZERO, actualSum = BigDecimal.ZERO;
for (int i = 0; i < testActual.size(); i++) {
    BigDecimal pred = ma.add(new BigDecimal(slope * (i + 1))).setScale(0, RoundingMode.HALF_UP);
    absErrorSum = absErrorSum.add(testActual.get(i).subtract(pred).abs());
    actualSum = actualSum.add(testActual.get(i).abs());
}
double mae  = absErrorSum.divide(new BigDecimal(testActual.size()), 2, RoundingMode.HALF_UP).doubleValue();
double wape = absErrorSum.divide(actualSum, 4, RoundingMode.HALF_UP)
        .multiply(new BigDecimal("100")).doubleValue();
// ...then refit on ALL months and predict `horizon` future months with a +/-8% band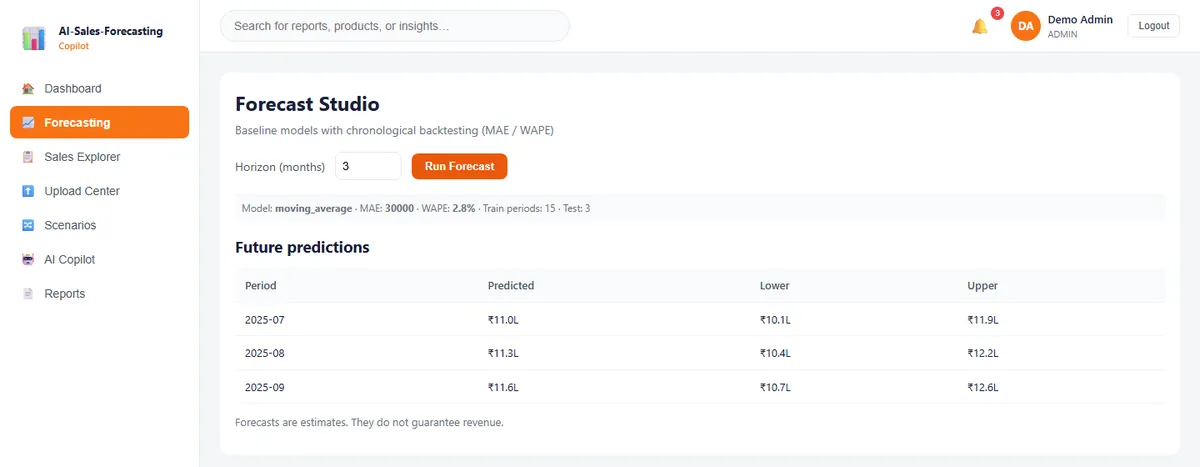
Avoid MAPE when some actual values can be zero — it explodes. Accuracy measures past performance; it is never a promise about the future.
12Step 5: The same forecast in Python and pandas
Data analysts usually prototype in Python first. The ZIP includes analysis/forecast_baseline.py, which repeats the Java logic with pandas: groupby by month, a time-based split, moving average + trend, MAE and WAPE. Running it on sample-data/sales_sample.csv gives exactly the same numbers as the Spring Boot API — a good way to check your maths.
def monthly_revenue(df):
    df = df.copy()
    df["sale_date"] = pd.to_datetime(df["sale_date"], format="%Y-%m-%d")
    df["month"] = df["sale_date"].dt.to_period("M")
    return df.groupby("month")["revenue"].sum().sort_index()

def ma_trend(train, k=3):
    k = min(k, len(train))
    ma = round(train.iloc[-k:].mean(), 2)
    slope = (train.iloc[-1] - train.iloc[0]) / (len(train) - 1)
    return ma, slope

def backtest(monthly):
    test_size = min(3, len(monthly) // 3)
    train, test = monthly.iloc[:-test_size], monthly.iloc[-test_size:]   # time split, never random
    ma, slope = ma_trend(train)
    preds = pd.Series([round(ma + slope * (i + 1)) for i in range(test_size)], index=test.index)
    abs_err = (test - preds).abs()
    mae = round(abs_err.mean(), 2)
    wape = round(abs_err.sum() / test.abs().sum() * 100, 1)
    return train, test, preds, mae, wape
pip install -r analysis/requirements.txt
python analysis/forecast_baseline.py --horizon 3 --plotOutput from our run:
Rows: 54  Months: 18  (2024-01 to 2025-06)

Backtest: trained on 15 months, tested on 3 months
          actual  predicted
2025-04  1040000    1012143
2025-05  1104000    1042286
2025-06  1072000    1072429
MAE  = 30,000.00
WAPE = 2.8%

Next 3 months (refit on all history):
 period  predicted   lower   upper
2025-07    1102118 1013949 1190287
2025-08    1132235 1041656 1222814
2025-09    1162353 1069365 1255341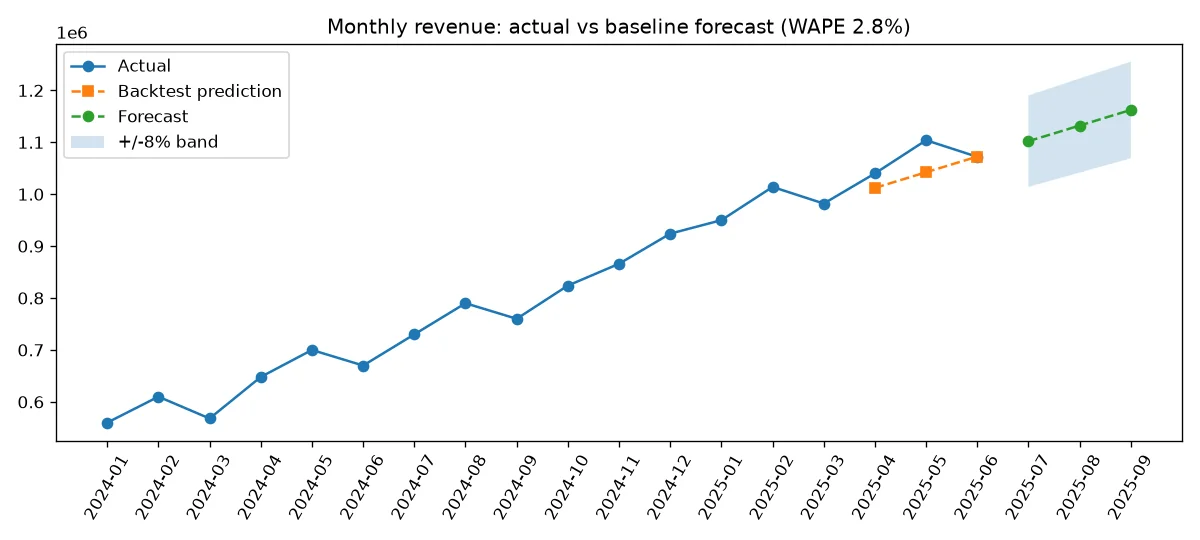
Meet the Data Analytics trainers
Stuck on a step of this project? These are the Uncodemy trainers who teach these skills in live classes. Book a free demo class and ask them your doubts directly.
 Ms. Rachna VermaData Analyst at GvCloud Secure (ex-Concentrix, ex-Test Yantra) · 4+ years
Data analyst at GvCloud Secure, earlier with Concentrix and Test Yantra, who builds Power BI dashboards and SQL reports. She teaches Power BI, DAX, SQL and Python in simple, beginner-friendly steps.
Power BIDAXSQLPostgreSQL Mr. Anshul GautamAcademic Faculty & Top Mentor at Uncodemy · 5+ years
Certified data scientist with a B.Tech in Computer Science who teaches data science and analytics at Uncodemy. His past roles include data analyst team lead at Amazon and data scientist at Tech Mahindra, working on credit risk analytics.
PythonSQLExcelPower BI Mr. Syed NajeebSenior Business Intelligence Analyst at Air India · 7+ years
Senior Business Intelligence Analyst in Air India's Customer Experience division, where he uses statistics, deep learning and NLP to improve customer experience. He teaches Python, Power BI, Tableau and SQL with live BI dashboards and real case studies.
PythonPower BITableauSQL & RDBMS13Step 6: AI copilot with grounded answers
The most important design rule: the LLM may only explain data the backend has already retrieved. It never invents numbers and never runs arbitrary SQL.
- Question
The user types e.g. “Which region is expected to decline next month?”
- Access check
The backend applies the organization filter (and, in a full build, role checks).
- Allow-listed tools
Only approved functions run: KPI summary, top products, top regions, forecast.
- Compact context
Only small, relevant results go to the LLM — or to the rule engine when no key is set.
- Answer
The reply includes figures, the time period and a caveat, plus the list of tools used and the mode.
// CopilotService.java (excerpt)
// 1. Always gather grounded data from allow-listed tools
Map<String, Object> kpi = analytics.getDashboardSummary(orgId);
List<Map<String, Object>> products = analytics.getTopProducts(orgId);
List<Map<String, Object>> regions = analytics.getTopRegions(orgId);
Map<String, Object> fc = forecast.runForecast(orgId, 3, "moving_average");

// 2. Build compact context (never send raw tables of thousands of rows)
StringBuilder context = new StringBuilder("AUTHORIZED DATA (use only these numbers):\n");
context.append("- Total Sales: ₹").append(kpi.get("totalSales")).append("\n");
// ... top products, regions, MAE / WAPE, next forecast periods ...

String system = """
    You are a sales analytics assistant for an internal business app.
    Answer ONLY using the AUTHORIZED DATA provided below.
    Never invent numbers, dates, or products.
    If the data is insufficient for the question, reply exactly: Insufficient data.
    End with one short sentence caveat that forecasts are estimates.
    """;

// 3. Prefer real LLM if key is set; otherwise grounded rule-based fallback
if (llm.isConfigured()) {
    try {
        result.put("answer", llm.chat(system, context + "\n\nUser question: " + question));
        result.put("mode", "llm");
        return result;
    } catch (Exception e) { result.put("llmError", e.getMessage()); }
}
result.put("answer", ruleBased(question, kpi, products, regions, fc));
result.put("mode", llm.isConfigured() ? "fallback" : "rule-based");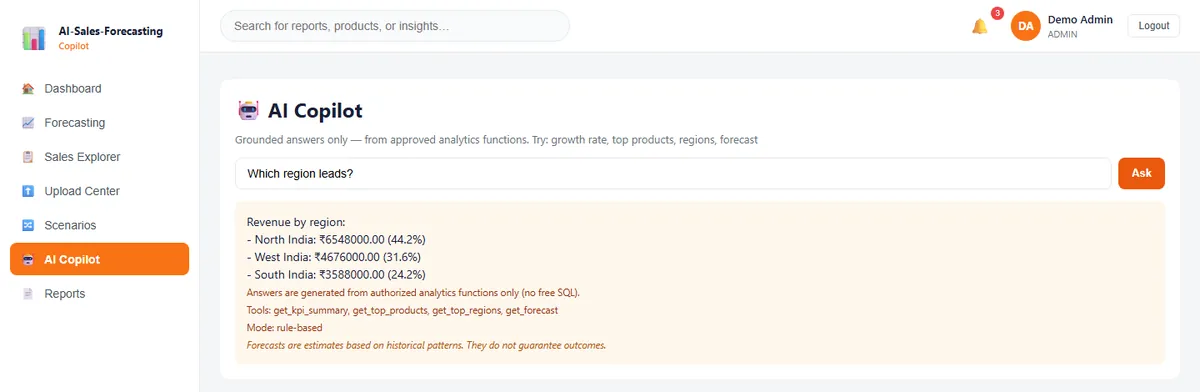
Guardrails (non-negotiable)
- Validate every tool argument before execution.
- Apply access control before any data is retrieved.
- Never expose secrets, API keys or internal details — the key stays in the backend environment.
- If data is insufficient, say “Insufficient data” instead of guessing.
14Step 7: Scenario planner and CSV upload
Scenarios apply a volume uplift on top of the baseline forecast without changing the saved baseline (POST /api/v1/scenarios with upliftPercent and horizon).
Upload Center accepts a CSV in this format. Dates must be YYYY-MM-DD and revenue is required; bad rows are rejected with a row number and reason.
sale_date,product,region,quantity,revenue,currency,order_id
2024-01-01,Product A,North India,120,240000,INR,ORD-1001
2024-02-01,Product A,North India,135,270000,INR,ORD-1002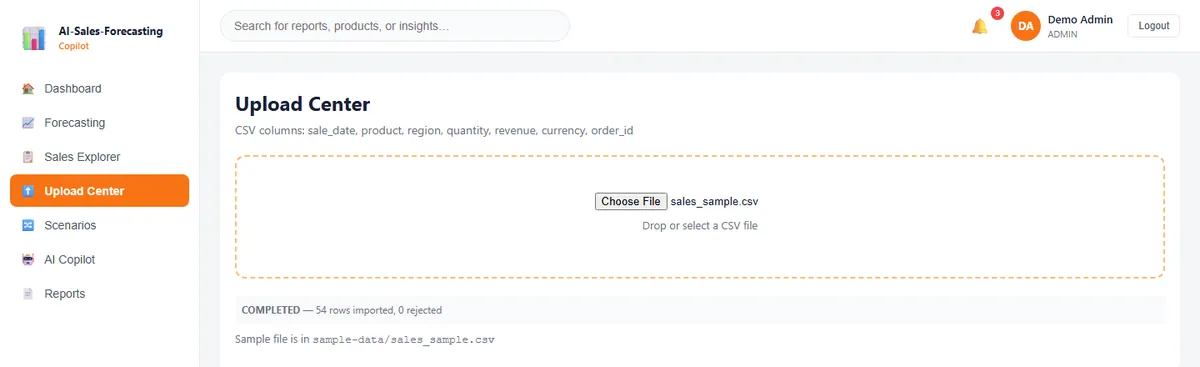
The importer does not check for duplicates. Uploading the sample file while the demo data is seeded doubles every total. Restart the backend to reset the in-memory database, or add a duplicate check on order_id.
15Step 8: Frontend screens
The MVP UI lives in frontend/src/App.tsx: a clean SaaS style with an orange accent (#f97316), navy text and light surfaces.
| Screen | Purpose |
|---|---|
| Dashboard | KPI cards, revenue trend, top products/regions, insights |
| Forecasting | Horizon selector, Run Forecast, MAE/WAPE, forecast table |
| Sales Explorer | Filterable table of sales records |
| Upload Center | CSV upload with validation summary |
| Scenarios | Volume uplift compared with baseline |
| AI Copilot | Chat that returns grounded answers with numbers |
| Reports | Latest forecast metrics |
The API base URL is a constant at the top of App.tsx (http://localhost:8080/api/v1). CORS in SecurityConfig allows localhost:5173, 5175 and 3000.
16Step 9: Testing
The original project had a single contextLoads() test that used the default PostgreSQL profile, so mvnw test failed on a laptop without PostgreSQL. In the download the test runs on the H2 demo profile and covers the important behaviour:
@SpringBootTest(properties = "app.llm.api-key=")
@ActiveProfiles("demo")            // H2 in-memory: no PostgreSQL needed
@AutoConfigureMockMvc
class SalescopilotApplicationTests {

    @Test
    void forecastUsesChronologicalBacktest() {
        Map<String, Object> result = forecastService.runForecast(1L, 3, "moving_average");
        Map<String, Object> metrics = (Map<String, Object>) result.get("metrics");
        assertEquals(15, metrics.get("trainingPeriods"));   // 18 months -> 15 train
        assertEquals(3, metrics.get("testPeriods"));        //            -> 3 test
    }

    @Test
    void copilotAnswersInRuleBasedModeWithoutKey() throws Exception {
        mvc.perform(post("/api/v1/copilot/messages")
                .contentType(MediaType.APPLICATION_JSON)
                .content("{\"question\":\"Which region leads?\"}"))
            .andExpect(jsonPath("$.mode").value("rule-based"))
            .andExpect(jsonPath("$.answer").value(containsString("North India")));
    }
}
cd backend
./mvnw test # Windows: mvnw.cmd test
# Tests run: 5, Failures: 0, Errors: 0, Skipped: 0 — BUILD SUCCESSIdeas for more tests: unit tests for MAE/WAPE with hand-calculated numbers, an import test with a bad row (wrong date, missing revenue), and a copilot test that checks “Insufficient data” for unrelated questions.
Presentation script (5–7 minutes)
Opening (30 s)
“I built an AI Sales Forecasting Copilot to make sales planning more data-driven and easier to explain to non-technical stakeholders.”
Problem (45 s)
“Teams spend a lot of time in spreadsheets. Forecasts are inconsistent across teams, and declining demand is often found too late.”
Solution (60 s)
“The app imports and validates sales data, calculates KPIs, generates baseline forecasts with accuracy metrics, visualizes actual versus predicted values, and answers questions using only authorized analytics.”
Architecture (45 s)
“React with TypeScript for the UI, Spring Boot for the APIs and business logic, PostgreSQL or H2 for data, and a transparent moving average + trend model. LLM calls happen only on the server and are grounded in real results.”
Live demo (2–3 min)
- Dashboard KPIs and the revenue trend.
- Run a forecast and point to MAE and WAPE.
- Upload the sample CSV and show the validation summary.
- Create a +10% scenario next to the baseline.
- Ask the copilot “Which region leads?” and show the supporting numbers.
Engineering decisions
- A simple, measurable baseline before any black-box model.
- Chronological backtesting to prevent data leakage.
- Every query filtered by organization.
- Forecast runs designed to be saved for reproducibility.
Honest limitations
“Forecast quality depends on data quality and changing business conditions. The copilot explains metrics; it does not guarantee outcomes or make decisions on its own.”
17Implementation plan (build it yourself)
Indicative solo timeline: 4–8 weeks. Build in this order and do not start with a complex LLM or deep-learning model.
| Phase | Work items | Days (solo) |
|---|---|---|
| 0 — Planning | Metrics, grain, schema, roles, wireframes, ERD | 1–2 |
| 1 — Setup | Repository, React/Vite, Spring Boot, Docker, README | 1 |
| 2 — Backend foundation | Profiles, CORS, validation, Flyway, health endpoint | 2–3 |
| 3 — Authentication | Users, roles, password hashing, Spring Security | 2–3 |
| 4 — CSV import | Upload endpoint, parser, validation, error reporting | 3–5 |
| 5 — Sales APIs | Search, filter, pagination | 2–3 |
| 6 — Dashboard | KPI APIs, trend data, charts | 3–4 |
| 7 — Forecast MVP | Aggregation, baseline models, backtesting, MAE/WAPE | 4–6 |
| 8 — Copilot | Allow-listed tools, LLM client, chat UI | 3–5 |
| 9 — Scenario / export | Uplift assumptions, comparison view, CSV export | 2–4 |
| 10 — Testing & polish | Unit + integration tests, responsive UI, docs | 4–6 |
| 11 — Deploy & demo | Docker, migrations, final walkthrough | 1–3 |
Start today — first five tasks
- Repository
Create the repo and a solid README (or unzip the provided code).
- Data
Prepare or check the synthetic CSV and a data dictionary (already in
sample-data/). - Design
Draw a dashboard wireframe and a database ERD — paper is fine.
- Backend base
Start H2 or PostgreSQL + Spring Boot with a health endpoint and the first Flyway migration.
- Hold the LLM
Do not add LLM code until import, KPIs and the baseline forecast work end-to-end.
18Final build checklist and known limitations
- README with setup, environment variables, screenshots, architecture and demo steps
- ER diagram + API documentation
- Synthetic CSV sample + data dictionary
- Working login and role checks
- CSV import with validation and clear errors
- Dashboard KPIs and charts
- Forecast with chronological backtesting and MAE / WAPE
- Copilot that answers only from authorized analytics
- Unit and integration tests + basic security checks
- Responsive UI
- Docker and deployment notes
- Presentation script and documented limitations
Known limitations in this MVP code (good things to improve)
- Security is simplified:
/api/v1/**ispermitAlland login returns a demo token, not a real JWT. - The dashboard Accuracy card (94.2%) and the dashboard trend's “forecasted” bars are fixed demo values; the real backtest is on the Forecasting screen.
- Insights on the dashboard are fixed text, not computed rules.
- The organization is hard-coded to 1 and forecast runs are not yet saved to
forecast_runs. - The importer has no duplicate check (see Step 7).
19Glossary
| Term | Simple meaning |
|---|---|
| Forecast | An estimate of a future value based on history and assumptions |
| Time series | Observations recorded at regular intervals (daily, weekly, monthly) |
| Backtesting | Testing a model on past periods that were not used to fit it |
| MAE | Mean Absolute Error — average size of the forecast error |
| WAPE | Weighted Absolute Percentage Error — error as a percentage of total actuals |
| Data leakage | Using information that would not be available at forecast time |
| RBAC | Role-Based Access Control — users only see what their role allows |
| LLM | Large Language Model — used here only to explain authorized results |
| RAG | Retrieval-Augmented Generation — retrieve real context first, then ask the LLM |
| Grounded answer | An answer based strictly on data the system actually retrieved |
20How to run the source code
Download the ZIP above, unzip it and follow these steps in a terminal inside the project folder.
- 1Download and unzip
unzip ai-sales-forecasting-copilot-project-source-code.zipNeeds Java 17/21 and Node.js 18+.
- 2Start the backend (H2 demo profile)
cd ai-sales-forecasting-copilot-project/backend && ./mvnw spring-boot:run -Dspring-boot.run.profiles=demoWindows: mvnw.cmd spring-boot:run "-Dspring-boot.run.profiles=demo". Seeds 54 sample rows.
- 3Check the API
curl http://localhost:8080/api/v1/healthReturns {"status":"UP"}.
- 4Start the frontend
cd ai-sales-forecasting-copilot-project/frontend && npm install && npm run devOpen http://localhost:5173 and sign in with admin@demo.com / admin123.
- 5Run the backend tests
cd backend && ./mvnw test5 tests on H2; no PostgreSQL or API key needed.
- 6Run the pandas forecast
pip install -r analysis/requirements.txt && python analysis/forecast_baseline.py --plotPrints MAE/WAPE and saves forecast_plot.png.
- 7Optional: real LLM answers
export OPENAI_API_KEY=your-key-hereRestart the backend; copilot answers show mode: llm.
Runs, with notes · checked 2026-11-18 on Java 21 (Temurin) + Maven 3.9.11 wrapper, Node 22 + Vite 8, Python 3.12 + pandas 3.1 on Windows 11
- ./mvnw test — 5 passed (H2 demo profile), also re-run from a fresh unzip of the download
- ./mvnw spring-boot:run (demo profile) — started, seeded 54 rows; health, dashboard, forecasts, scenarios, copilot, login and CSV import endpoints all returned data
- npm install && npm run build — TypeScript + Vite build passed; npm run dev — all 7 screens used in Chromium, no console errors
- python analysis/forecast_baseline.py --plot — MAE 30,000 and WAPE 2.8%, identical to the Java API
- Browser demo tested in a sandboxed iframe at 1200px and 360px — forecast, table and copilot answers work, no console errors
Works offline with the rule-based copilot. PostgreSQL mode and the real OpenAI mode were not run (no Docker daemon, no paid API calls). Small fixes in the download: added the missing Maven wrapper settings, made the test use the H2 profile, moved DB/JWT values to environment variables.
21Troubleshooting
./mvnw fails with “cannot read distributionUrl property”
The <code>backend/.mvn/wrapper/maven-wrapper.properties</code> file is missing. It is included in this download; if you copied only <code>src/</code>, copy the <code>.mvn</code> folder too, or install Maven and run <code>mvn</code> instead.
mvnw test or spring-boot:run says “Connection to localhost:5432 refused”
You are on the default PostgreSQL profile. Add <code>-Dspring-boot.run.profiles=demo</code> to use H2, or start PostgreSQL with <code>docker compose up -d</code>.
On Windows PowerShell the profile flag is ignored
Quote it: <code>mvnw.cmd spring-boot:run "-Dspring-boot.run.profiles=demo"</code>. PowerShell splits arguments at the dot otherwise.
Dashboard is empty or shows CORS errors in the browser console
Start the backend first and keep it on port 8080. The frontend must run on an allowed origin (localhost:5173, 5175 or 3000); if Vite picks another port, add it in <code>SecurityConfig</code>.
All totals doubled after uploading the sample CSV
The demo data is already seeded and the importer has no duplicate check. Restart the backend (H2 is in-memory) or upload a CSV with new months.
Copilot shows mode “fallback”
An API key is set but the LLM call failed (wrong key, no network or quota). The answer still comes from the rule engine; check <code>llmError</code> in the JSON response.
22Interview questions on this project
Practice questions an interviewer or viva examiner may ask about this project.
Why do you split time-series data chronologically and not randomly?
A random split puts future months into training, so the model “sees the future” (data leakage) and the error looks better than it will be in real use. A time split trains on earlier months and tests on later ones, exactly like a real forecast.
What are MAE and WAPE, and why not MAPE?
MAE is the average absolute error in rupees. WAPE is the total absolute error divided by total actuals, as a percentage, so it compares products of different size. MAPE divides by each actual value, so it explodes when an actual is zero or very small.
How does the moving average + trend model work here?
It averages the last k = 3 months, computes a slope from the first to the last training month, and predicts month i ahead as MA + slope × i. It is transparent and gives a baseline that any more complex model must beat.
How do you stop the LLM from inventing numbers?
The backend calls only allow-listed analytics functions, builds a compact “authorized data” context, and the system prompt says to use only those numbers and reply “Insufficient data” otherwise. The LLM never gets database access or free SQL.
Why is the copilot useful even without an API key?
A rule-based engine answers common questions (growth, top products, regions, forecast) from the same grounded data, so the app works offline and has a fallback if the LLM call fails. The response shows the mode used.
Why store revenue as DECIMAL instead of float?
Floating-point numbers cannot represent many decimal values exactly, so sums drift by small amounts. DECIMAL (BigDecimal in Java) keeps money exact.
How would you improve the forecast model?
Compare the baseline with seasonal naive, exponential smoothing (Holt-Winters) or ARIMA using the same backtest, forecast per product/region, add seasonality features and use rolling-origin backtests. Keep the model only if WAPE improves.
How do you make a multi-tenant analytics app secure?
Filter every query by organization_id from the authenticated user, enforce role checks before data retrieval, keep secrets in environment variables and never send API keys to the browser.
23Put it on your resume
Resume points
- Built a full-stack sales forecasting app (React, TypeScript, Spring Boot, H2/PostgreSQL) with KPI dashboard, CSV import validation and scenario planning
- Implemented a moving average + trend forecast with chronological backtesting, reaching 2.8% WAPE on an 18-month sample dataset
- Designed a grounded AI copilot that answers only from allow-listed analytics functions, with an offline rule-based fallback
- Reproduced the forecast in Python/pandas and matplotlib to validate the Java results and visualise actual vs forecast
- Wrote Spring Boot integration tests (MockMvc, H2) for the forecast split, copilot mode and input validation
Ideas to extend it
- Compute the dashboard Accuracy card from real WAPE (100 − WAPE) and show actual vs backtest on the trend chart
- Add seasonal naive and Holt-Winters models and compare them with the baseline on the same backtest
- Forecast per product and per region and flag the region with the largest expected decline
- Save every run to forecast_runs / forecast_values / forecast_metrics and show a run history on the Reports screen
- Add a duplicate check on order_id and a column-mapping step to the CSV upload
- Replace the demo login with real JWT + role-based access on every endpoint
Uncodemy course
Turn this project into a job-ready skill
The core of this project is data analytics work: cleaning and validating sales data, aggregating it by month, building KPIs, measuring forecast error with MAE and WAPE, and presenting results on a dashboard. Uncodemy's Data Analytics course covers Excel, SQL, Python with pandas, statistics and Power BI / Tableau dashboards, which are the skills you need to build, explain and extend a project like this.
- Duration6–7 months
- Training120+ hours
- Modules9 modules
- Projects5 guided projects + 1 capstone
What you learn in the Data Analytics Course
- Excel for Data Analytics (Pivot Tables, Power Query)
- SQL & Database Management (joins, CTEs, window functions)
- Python for Data Analytics (NumPy, Pandas, Matplotlib, Seaborn)
- Statistics & Business Mathematics (hypothesis testing, A/B testing)
- Data Cleaning & Exploratory Data Analysis
- Power BI (data modelling, DAX)
- Tableau
- AI & Gen AI for Data Analysts (prompting, Copilot, checking AI output)
- Capstone Projects & Career Preparation
Uncodemy Certificate · Uncodemy Agile Certificate · Module Completion Certificate · Dedicated Placement Support · Classroom in Noida & Delhi or live online
Learn Data Analytics with a free demo class
- See how the trainer explains a real project like this one
- Get your setup or code doubts cleared live
- Understand the course plan, batches and Dedicated Placement Support
“Uncodemy played a crucial role in transforming my career. The trainers were knowledgeable, approachable, and always focused on practical learning. The hands-on training, live projects, and personalized guidance made complex concepts easy to understand.”
Ankit Singh, Finelabs
“Enrolling at Uncodemy was a turning point in my learning journey. The mentors guided me with real-world projects, practical sessions, and continuous feedback that built my confidence.”
Divya Pandey, Qualys
“Uncodemy has truly transformed my learning journey! The practical sessions, real-time projects, and continuous mentor guidance helped me build strong analytical skills and industry-ready knowledge.”
Hashir, FedEx
From Uncodemy learner stories. Individual results vary.
24Frequently asked questions
Is the source code really free to download?
Yes. The ZIP has the full React frontend, Spring Boot backend, sample data, tests, a pandas script and a browser demo. No form or sign-up is needed.
Do I need an OpenAI API key?
No. Without a key the copilot uses a rule-based engine that answers from the same grounded data. A key only switches it to LLM-written answers.
Do I need to install PostgreSQL?
No. The demo profile uses an in-memory H2 database with sample data. PostgreSQL via Docker Compose is optional.
Is this a good final-year project for data analytics students?
Yes. It covers data validation, aggregation, forecasting, accuracy metrics, dashboards and responsible AI, and it comes with a ready 5–7 minute presentation script.
I only know Python, not Java. Can I still use it?
Yes. Start with analysis/forecast_baseline.py and the browser demo to understand the forecast, then read ForecastService.java, which follows the same steps line by line.
Are the forecasts accurate for real business use?
The model is a transparent baseline. On the sample data it reaches 2.8% WAPE, but real accuracy depends on your data and conditions. Forecasts are estimates, not guarantees.
Can I add this project to my resume and GitHub?
Yes. Use the resume points above, add your own improvements (for example a seasonal model or real JWT auth) and explain your design choices in the README.
More free projects
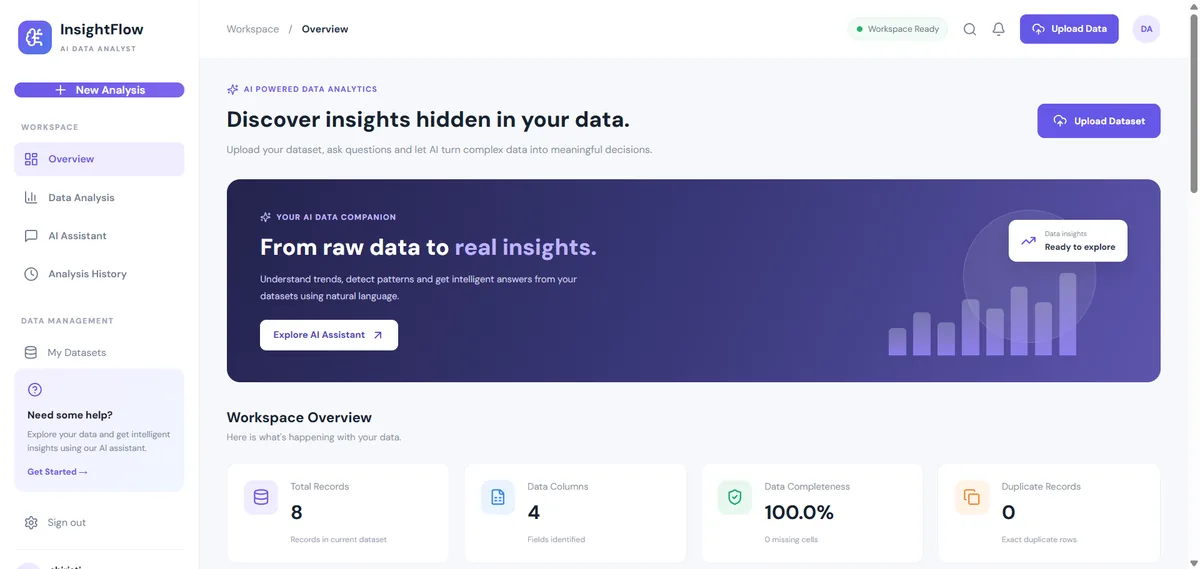 Data & AI · IntermediateAI Data Analyst Agent
Upload a CSV or Excel file, get an instant data-quality report and ask questions about your data. No API key needed.
React 18 · Vite · Node.js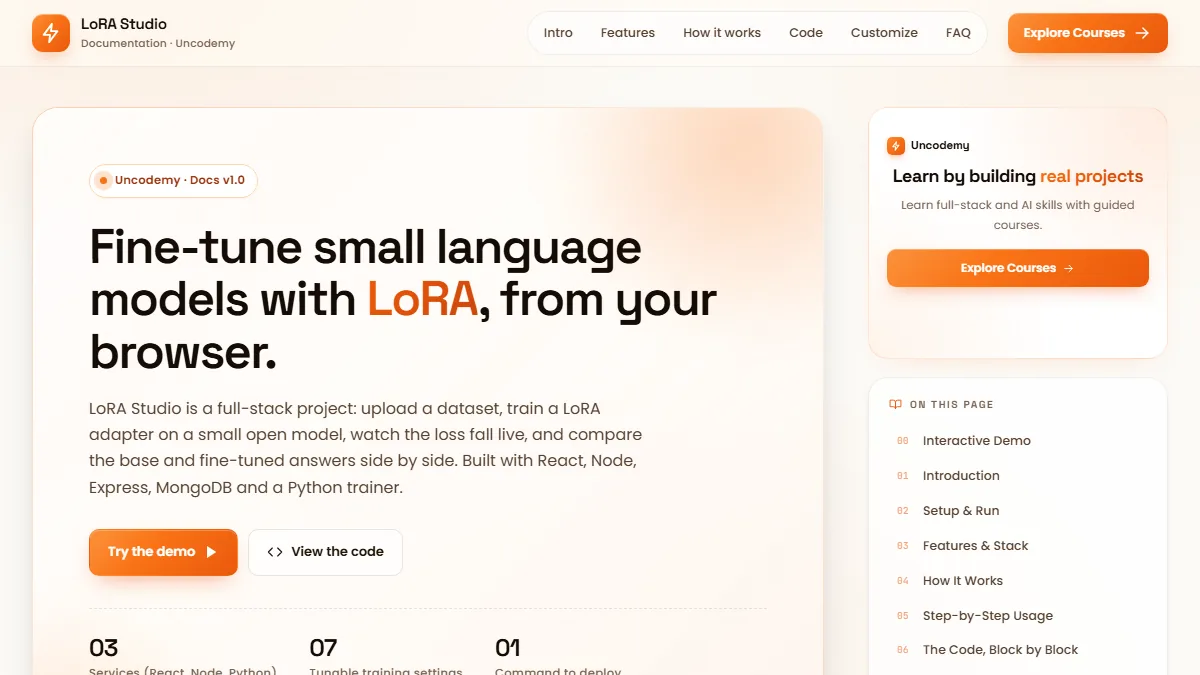 Data & AI · AdvancedLoRA Studio
Upload a dataset, fine-tune a small open model with LoRA, watch the loss fall live and compare base vs fine-tuned answers.
React 18 · Vite · Recharts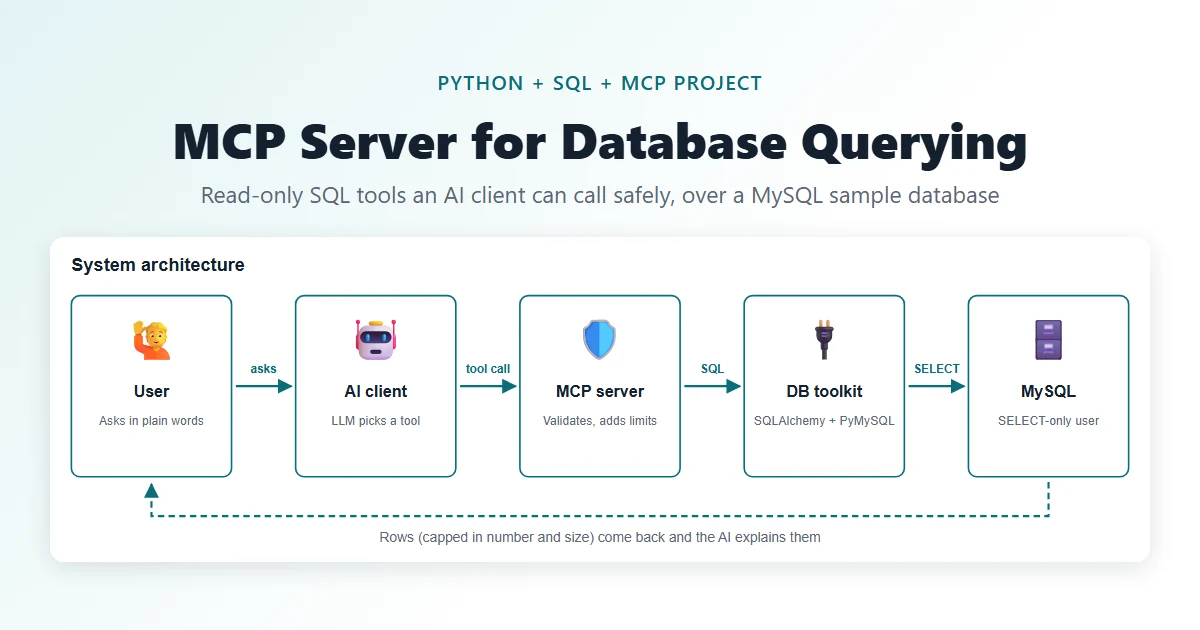 Data & AI · IntermediateMCP Server for Database Querying
Let an AI assistant ask your database questions through five safe, read-only tools.
Python · MCP Python SDK (FastMCP) · MySQL 8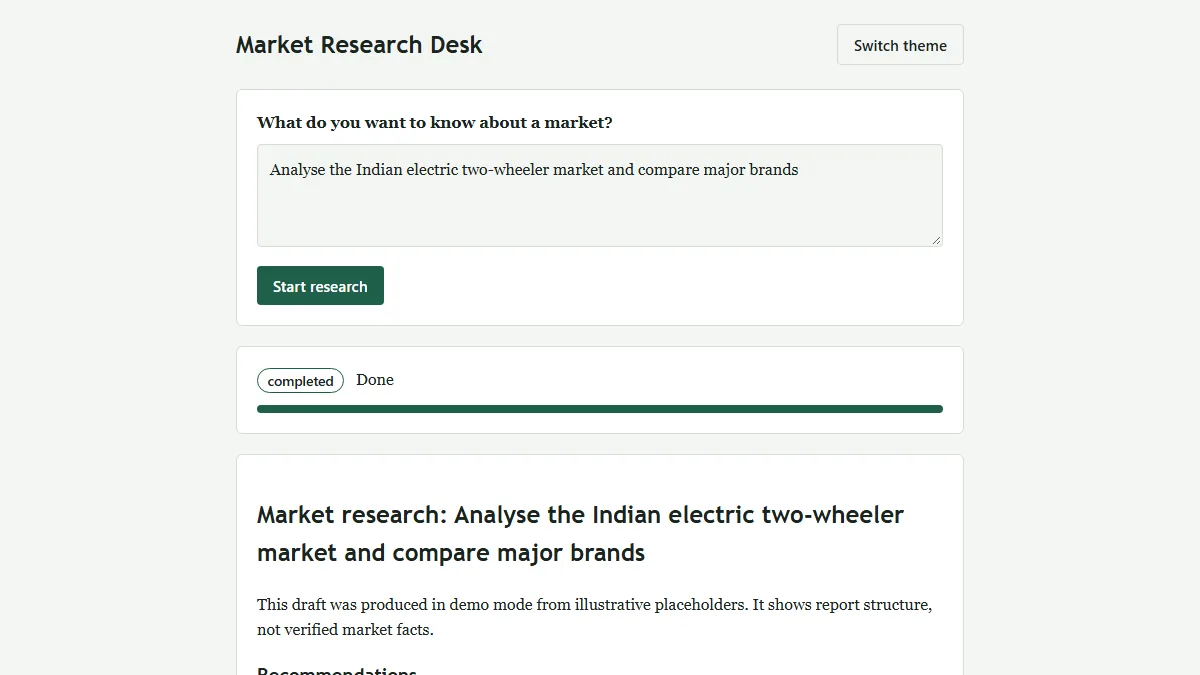 Data & AI · IntermediateMulti-Agent Market Research System
One question in, a structured and evidence-flagged market research report out (HTML + PDF).
Python 3.12 · FastAPI · Uvicorn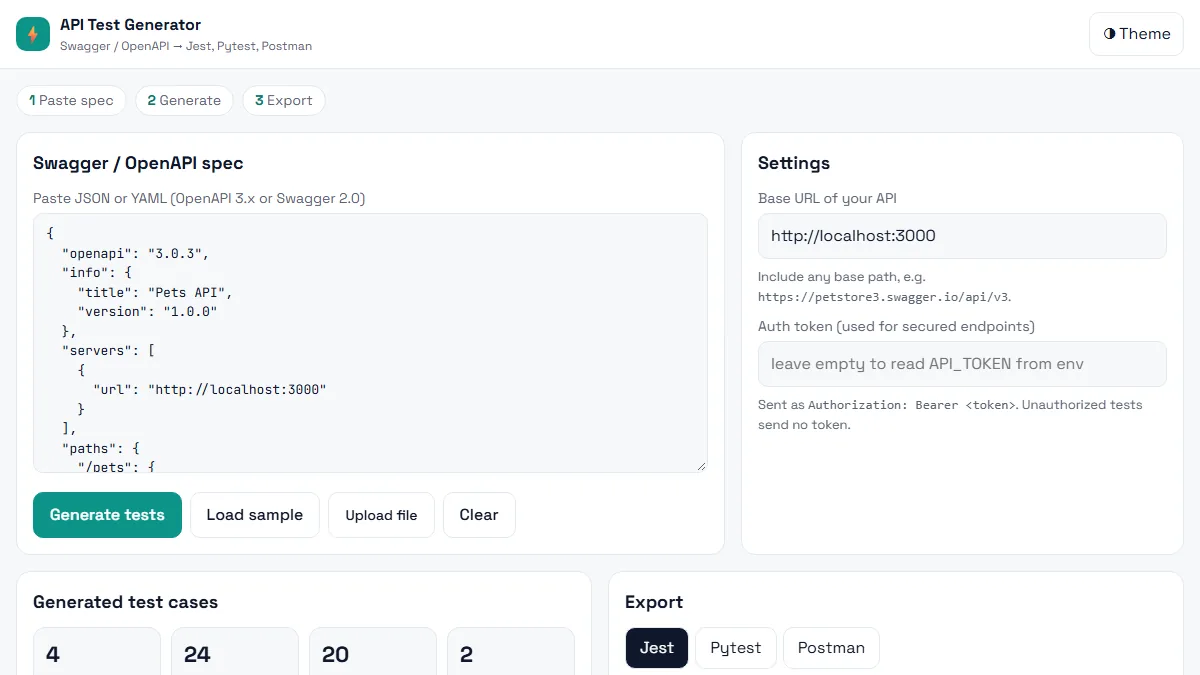 Testing · BeginnerAI API Test Generator
Paste a Swagger / OpenAPI spec and get positive, negative and boundary API tests in Jest, Pytest or Postman in seconds.
HTML5 · CSS3 (Grid, Flexbox, variables) · Vanilla JavaScript (ES6+)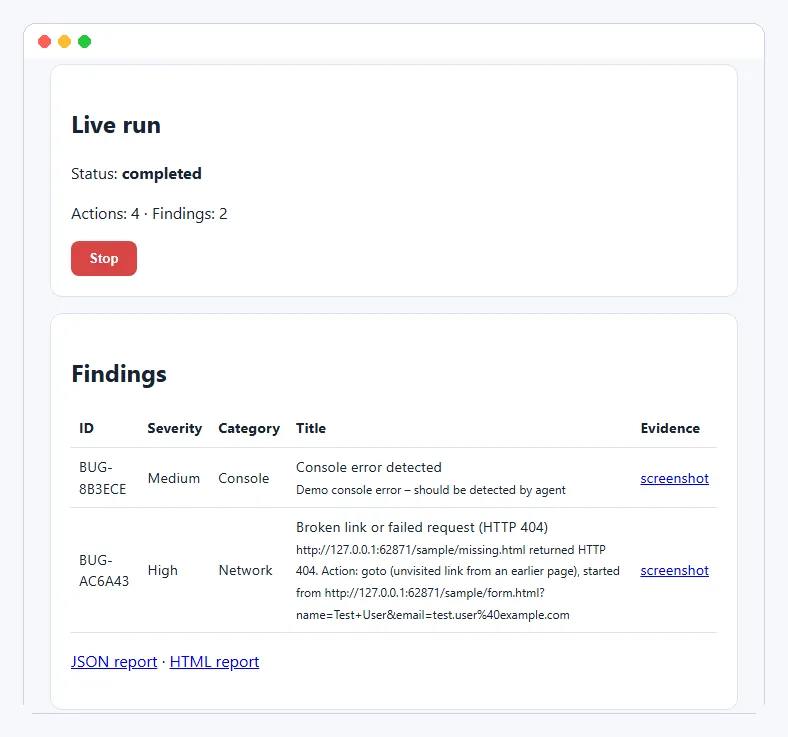 Testing · IntermediateAI Exploratory Testing Agent
A browser agent that explores your web app on its own, finds evidence-backed bugs and writes the report for you.
Python 3.11+ · Playwright (Chromium) · FastAPIThis project is shared for learning. The code is provided as is; read it, run it and change it. Do not commit real API keys: use the .env.example file. Interview questions are practice questions, not a record of any company's interviews.